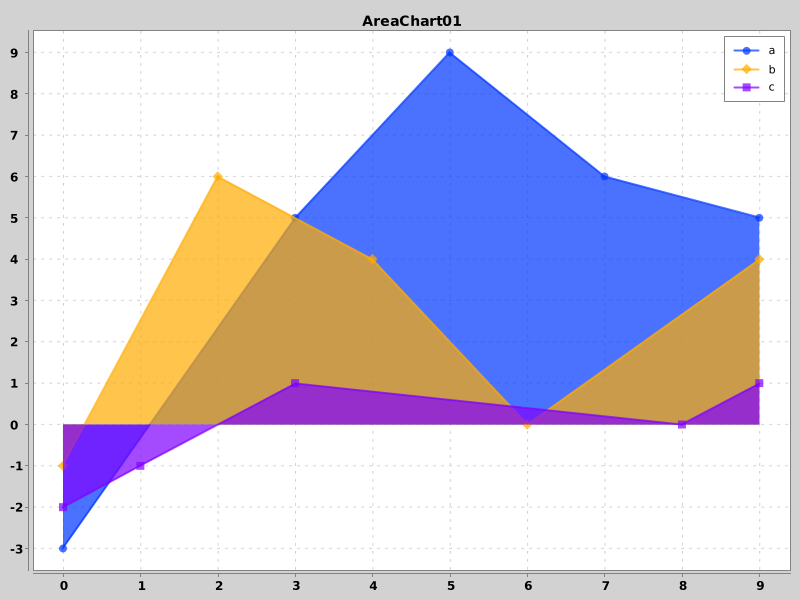
AreaChart01 - 3-Series
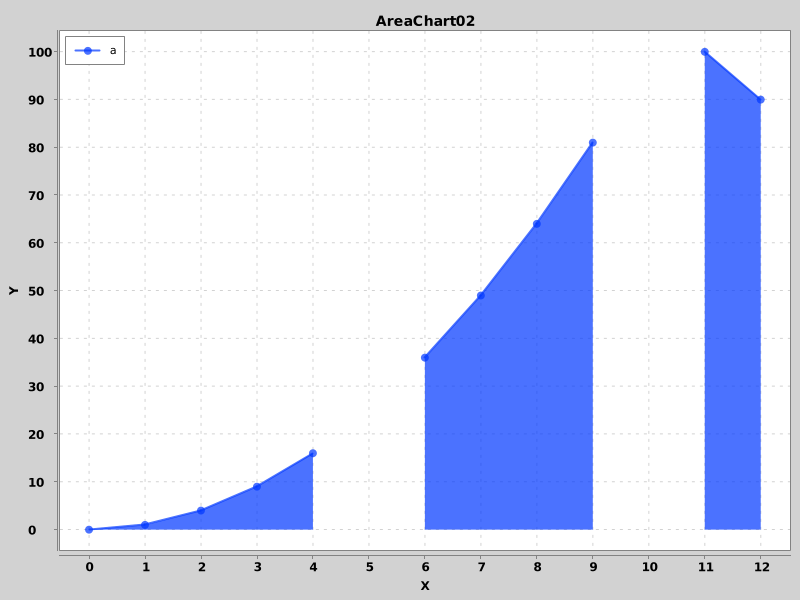
AreaChart02 - Null Y-Axis Data Points
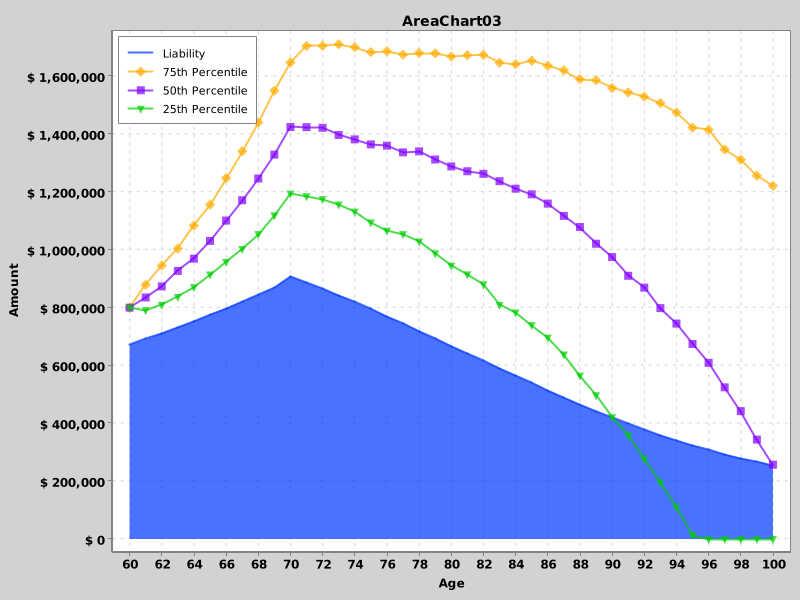
AreaChart03 - Combination Area & Line Chart
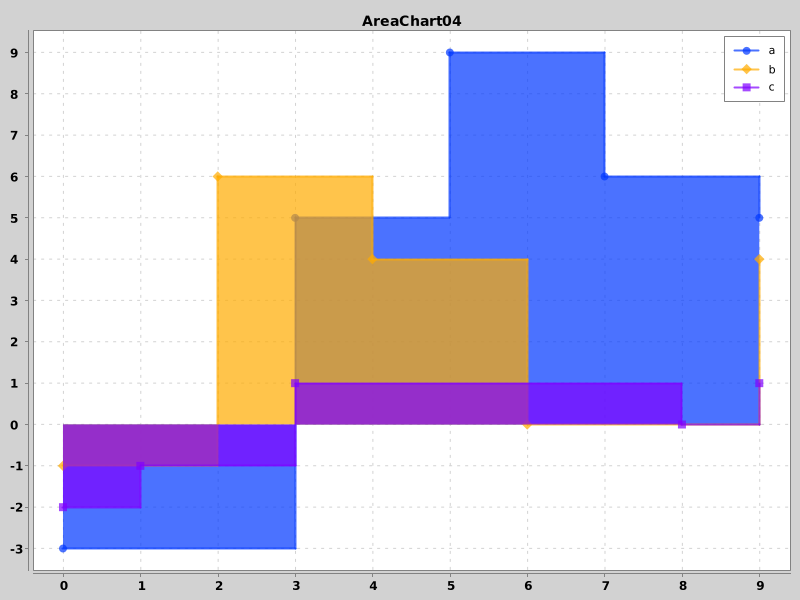
AreaChart04 - Step Area Rendering
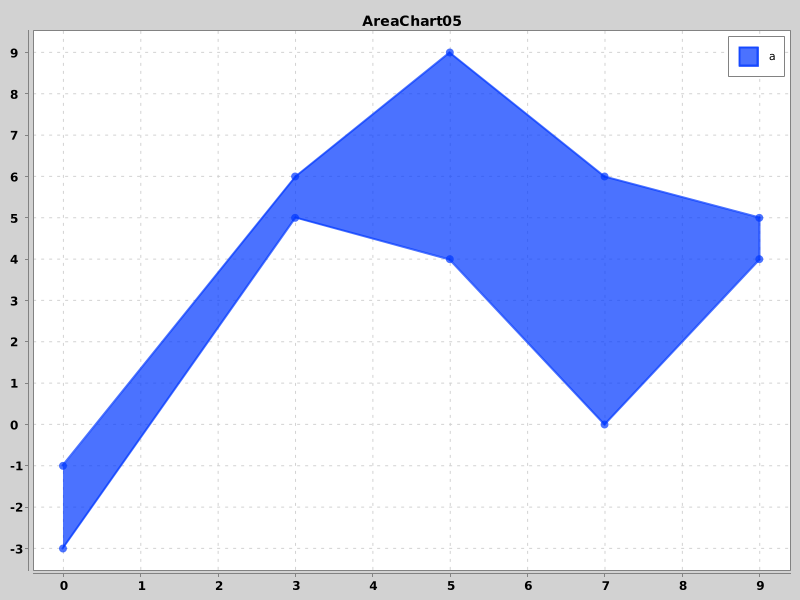
AreaChart05 - Polygon Area Rendering
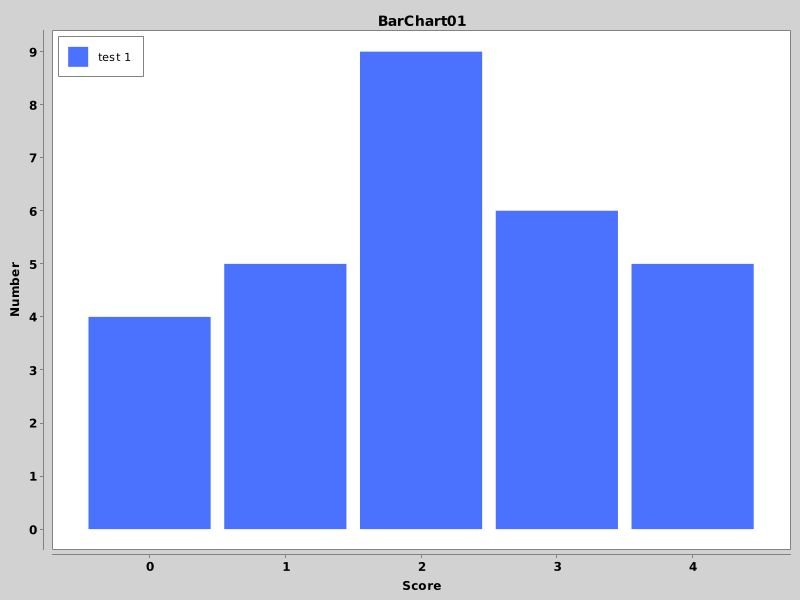
BarChart01 - Basic Bar Chart
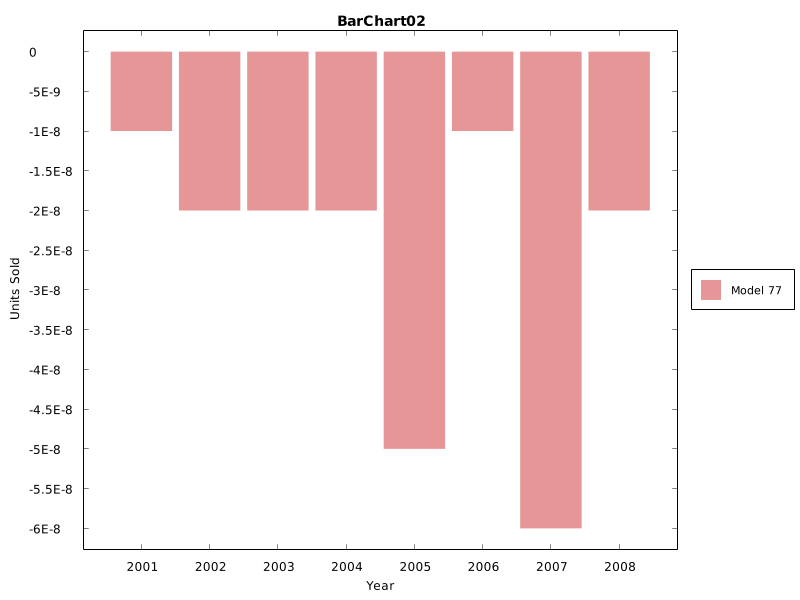
BarChart02 - Date Categories
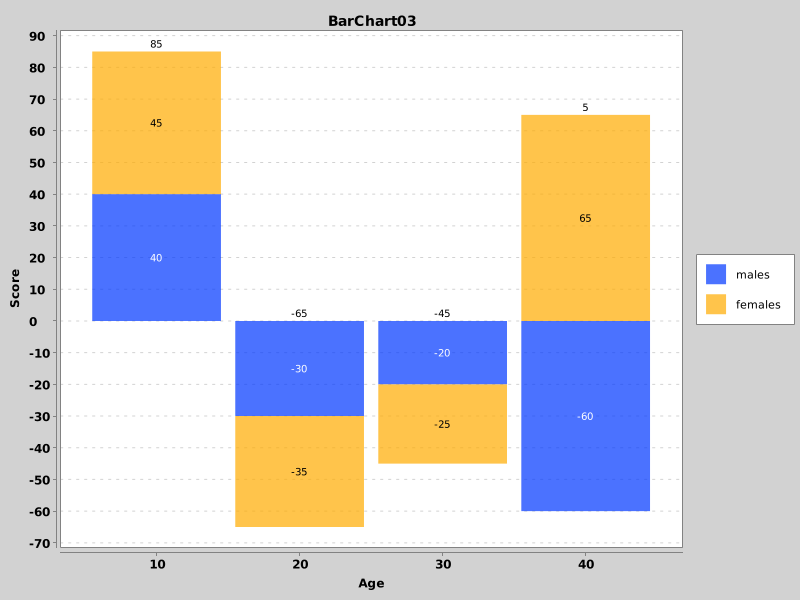
BarChart03 - Stacked Bar Chart with Data and Stack Sum Labels
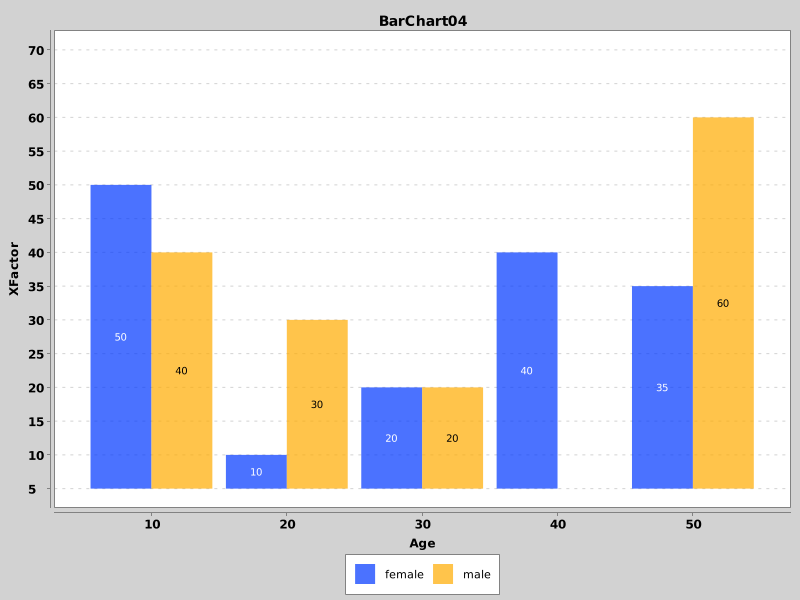
BarChart04 - Missing Point in Series
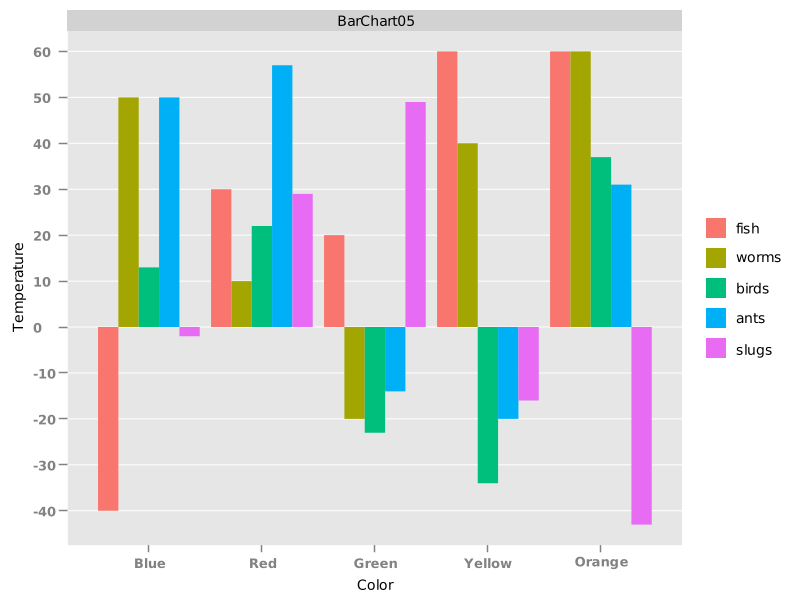
BarChart05 - GGPlot2 Theme
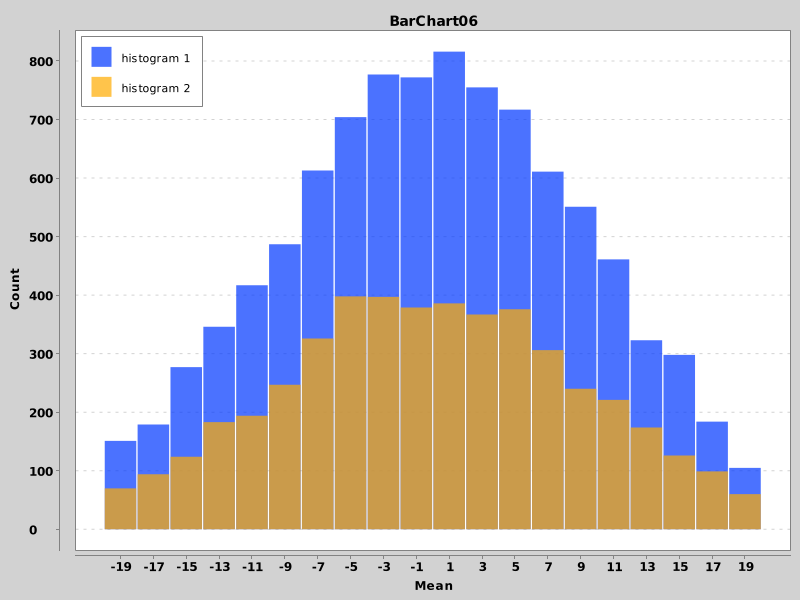
BarChart06 - Histogram Overlapped
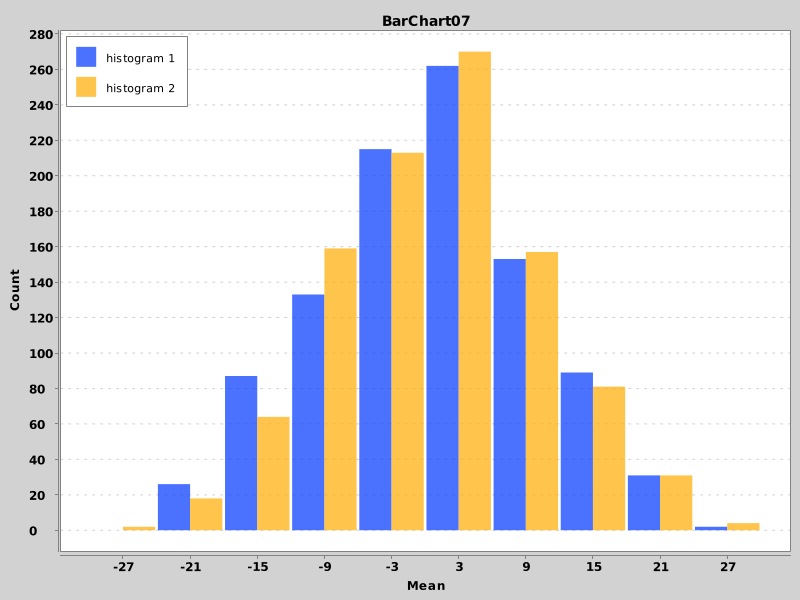
BarChart07 - Histogram Not Overlapped with Tool Tips
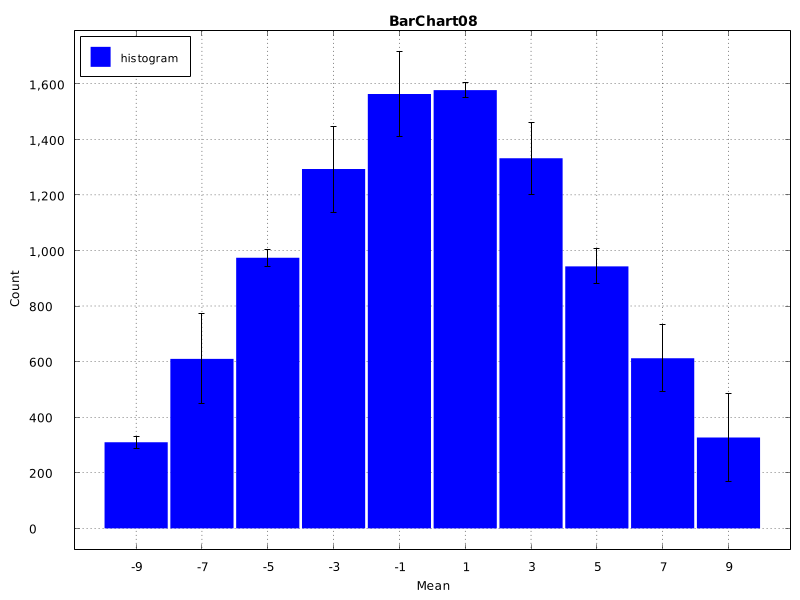
BarChart08 - Histogram with Error Bars
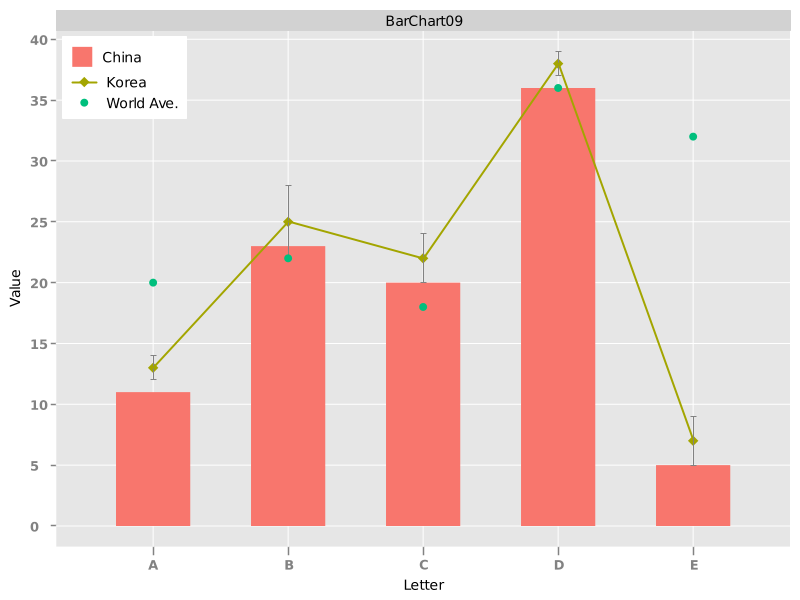
BarChart09 - Category chart with Bar, Line and Scatter Series
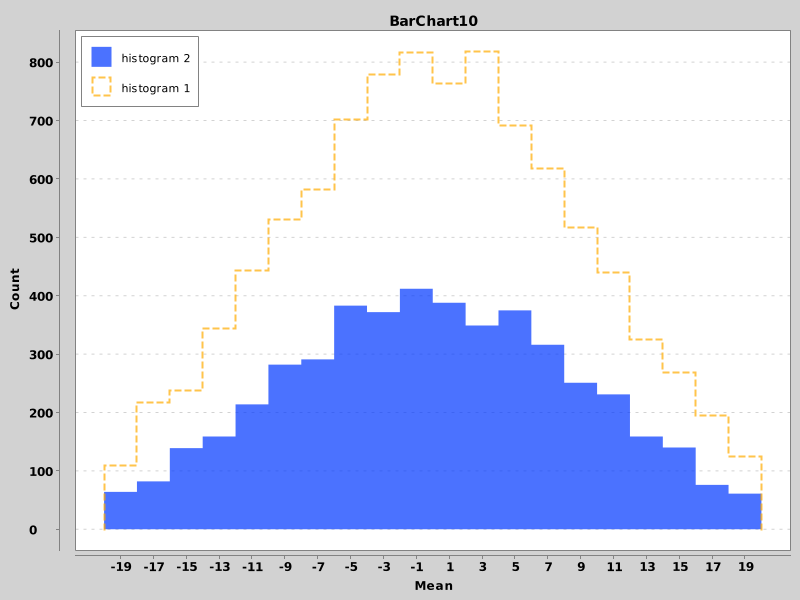
BarChart10 - Stepped Bars with Line Styling
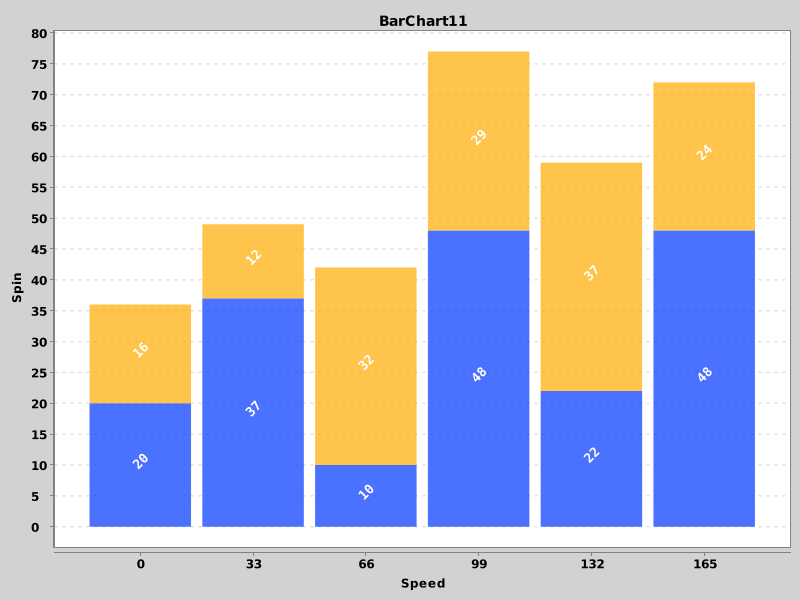
BarChart11 - Stacked Stepped Bars with Customized Data Labels
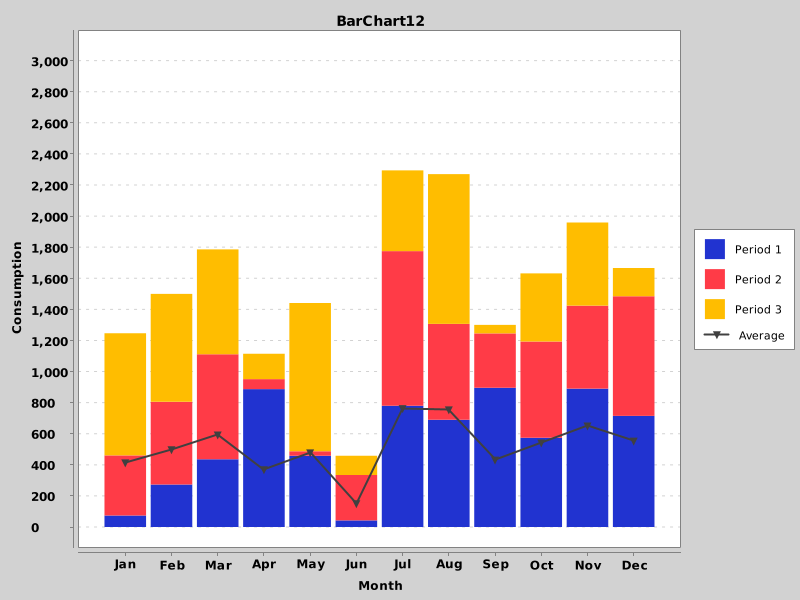
BarChart12 - Stacked Bars with Overlapped Line Chart
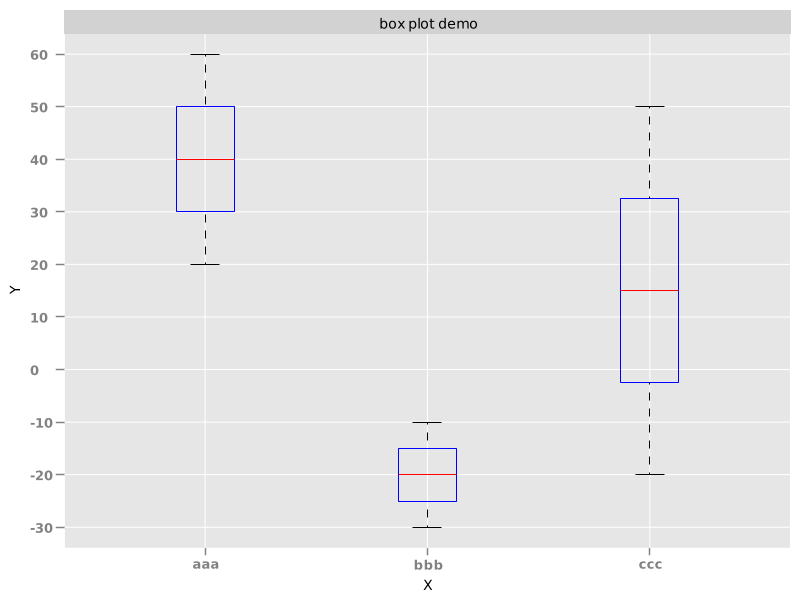
BoxChart01- 3 Boxes
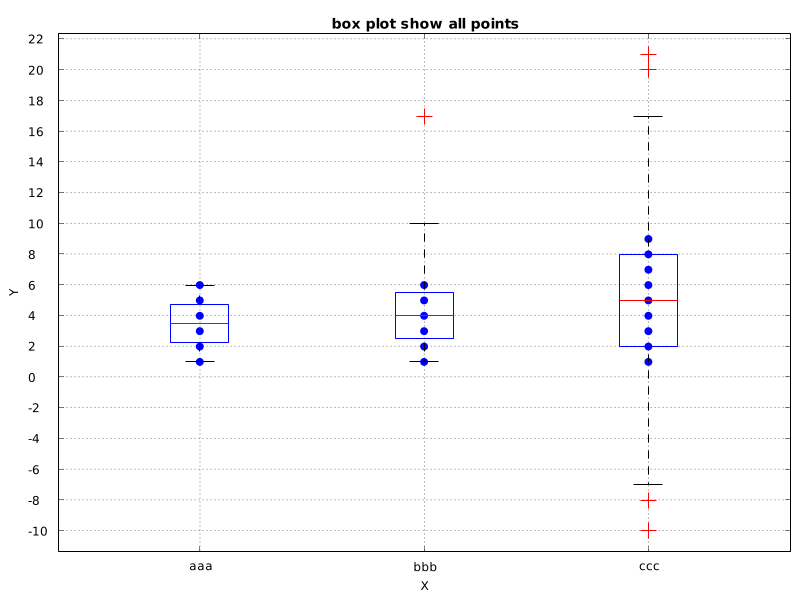
BoxChart02- Show normal points and abnormal points
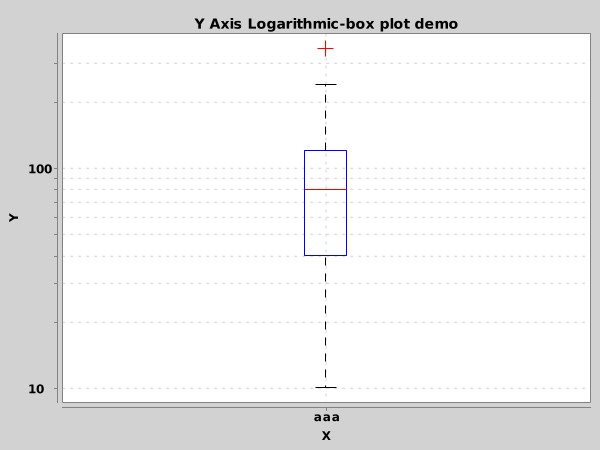
BoxChart03 - Logarithmic Y-Axis
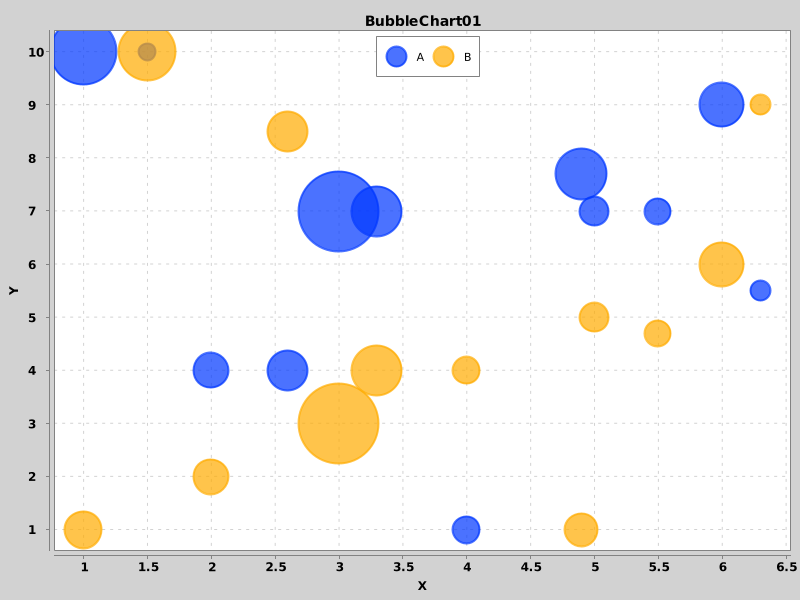
BubbleChart01 - Basic Bubble Chart
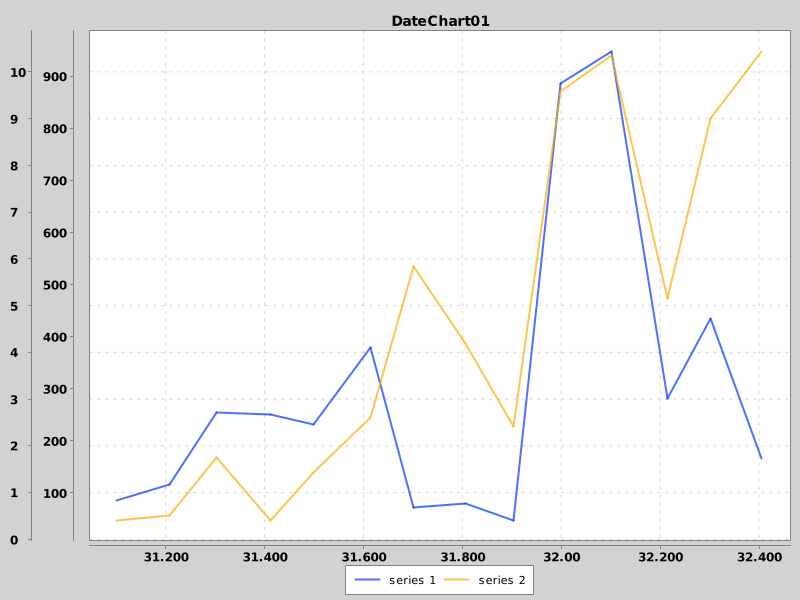
DateChart01 - Millisecond Scale with Two Separate Y Axis Groups
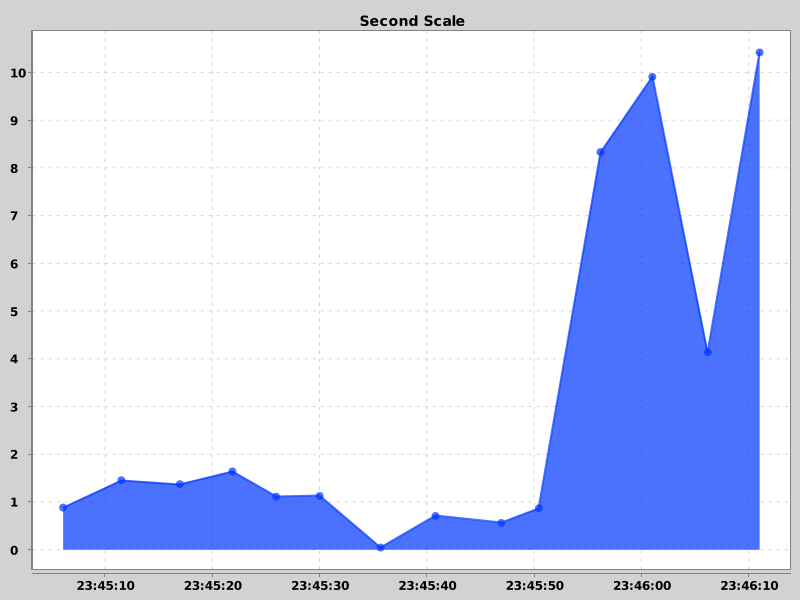
DateChart02 - Second Scale
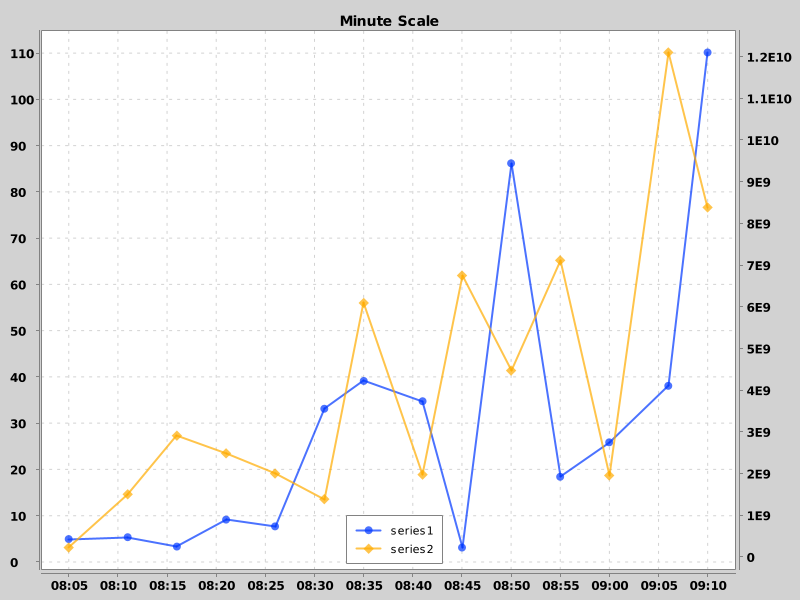
DateChart03 - Minute Scale with Two Separate Y Axis Groups
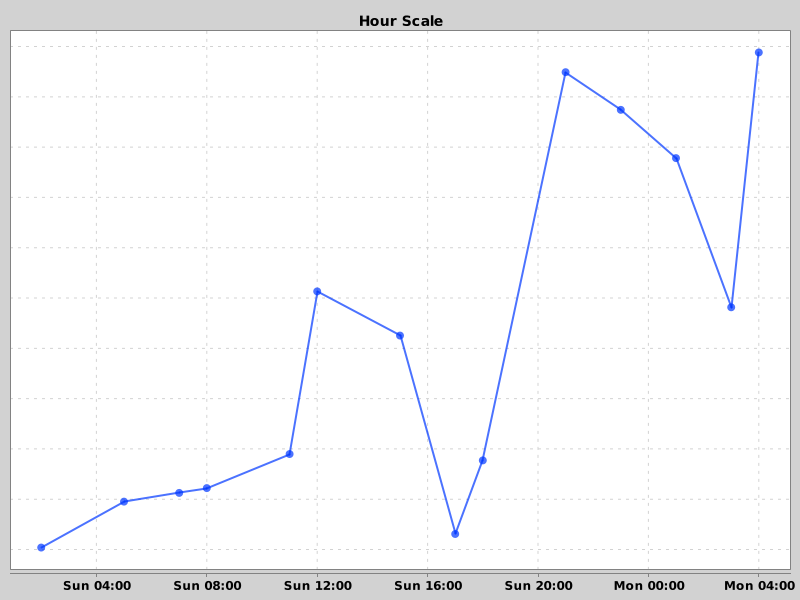
DateChart04 - Hour Scale
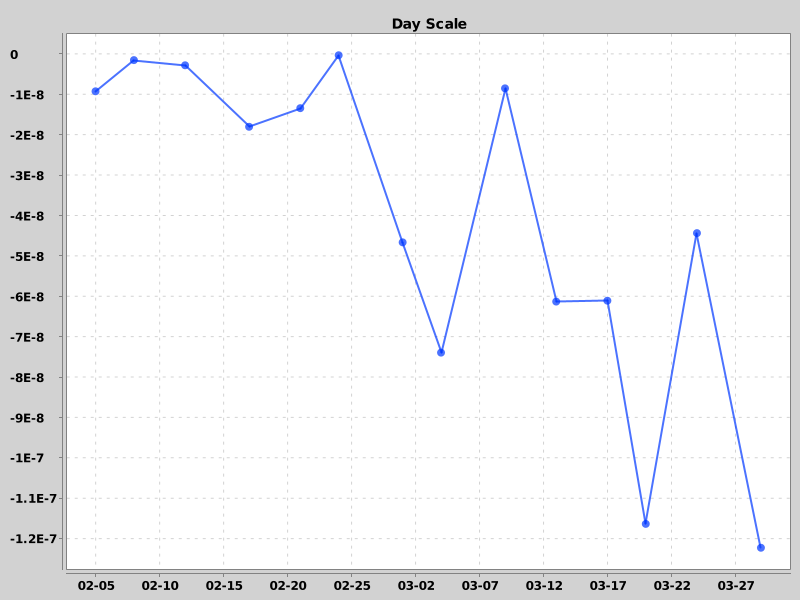
DateChart05 - Day Scale
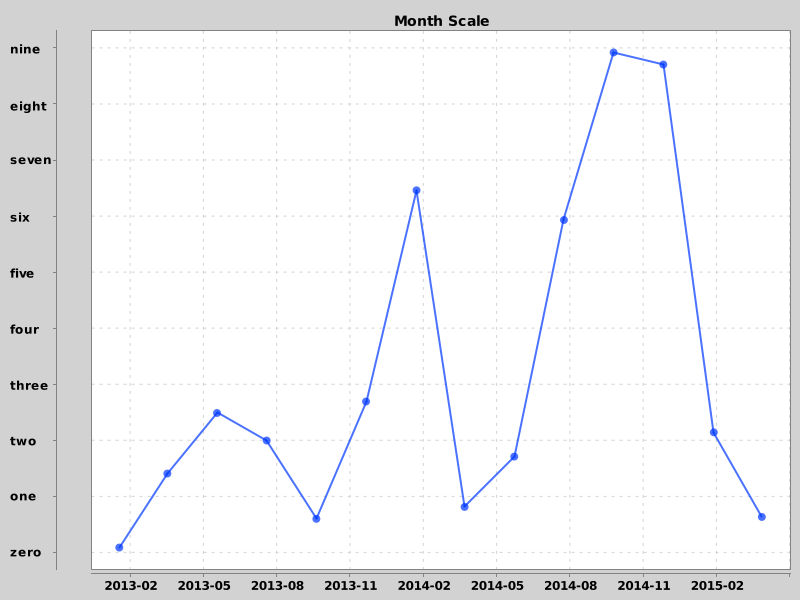
DateChart06 - Month Scale with custom Y-Axis tick labels
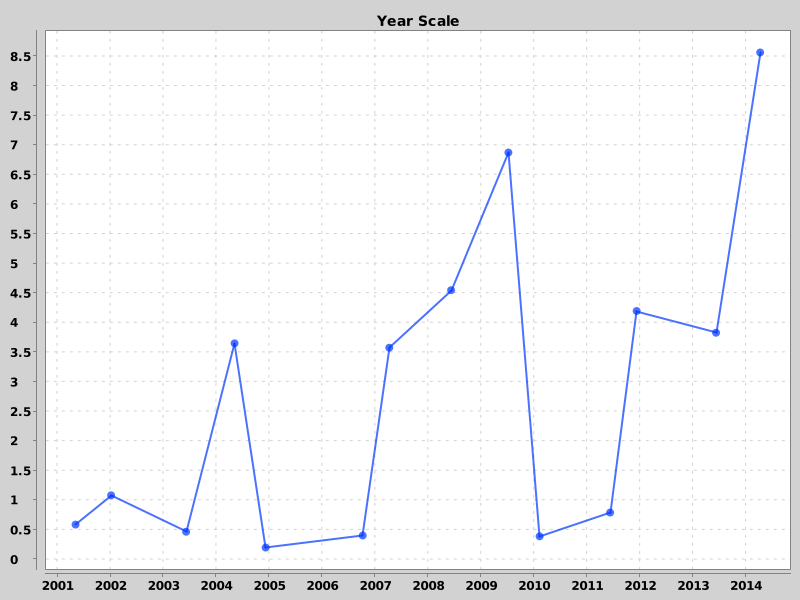
DateChart07 - Year Scale
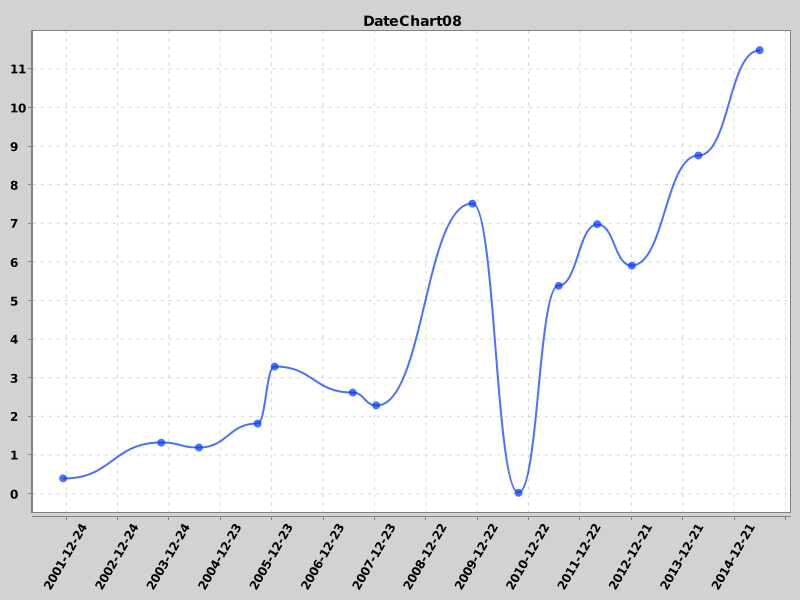
DateChart08 - Rotated Tick Labels
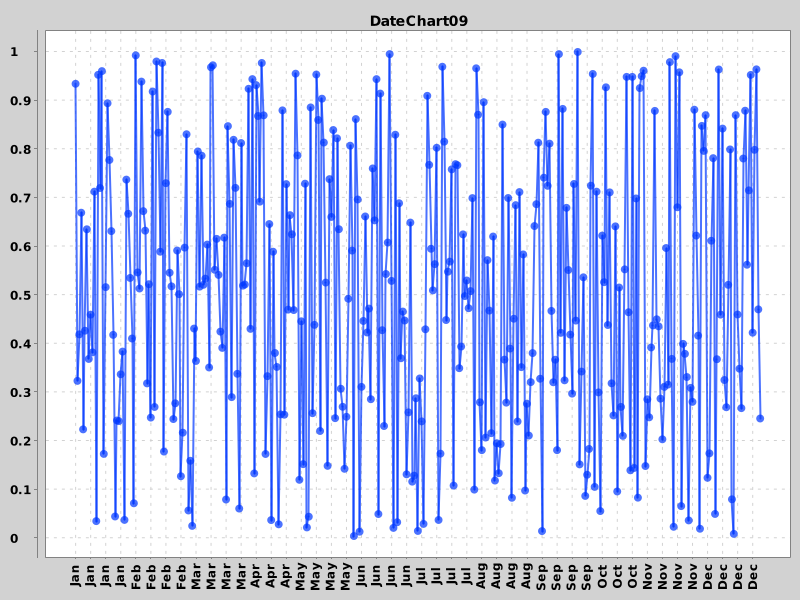
DateChart09 - Custom Date Formatter Without Years
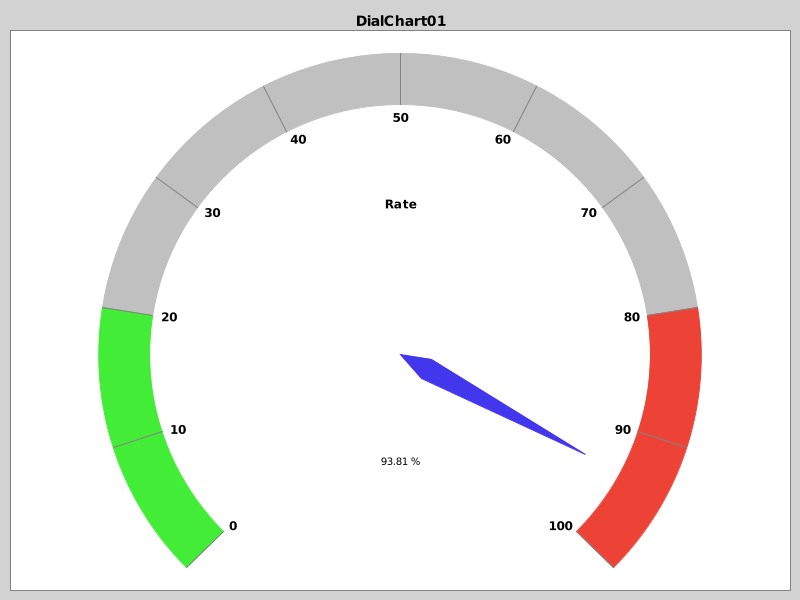
DialChart01 - Basic Dial Chart
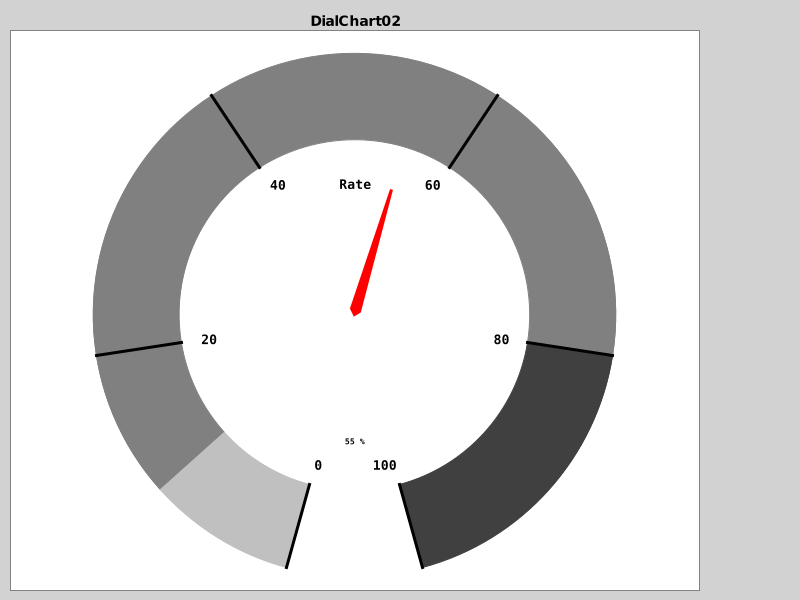
DialChart02 - Highly Customized Dial Chart
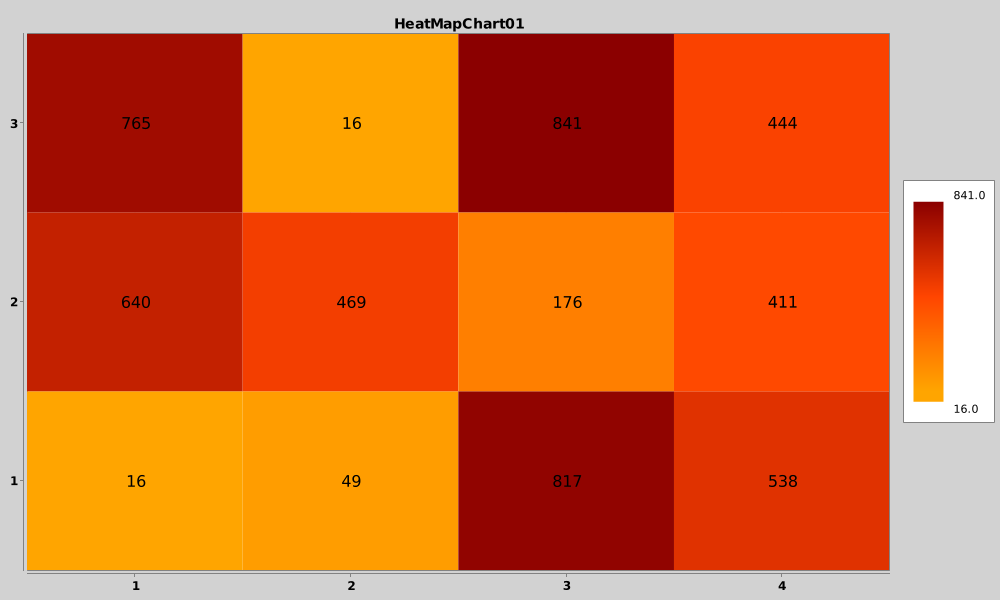
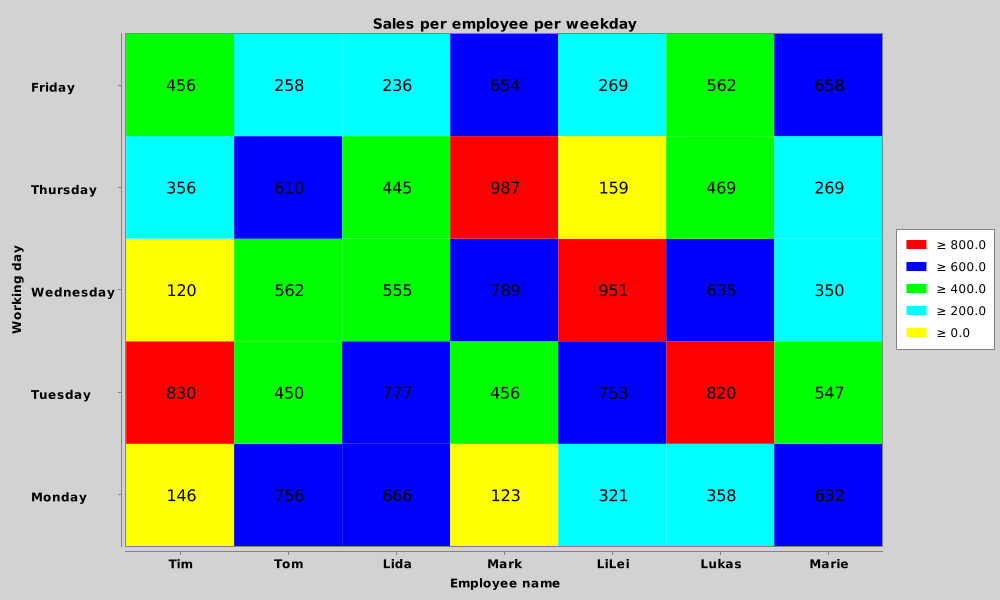
HeatMapChart01- Basic HeatMap Chart
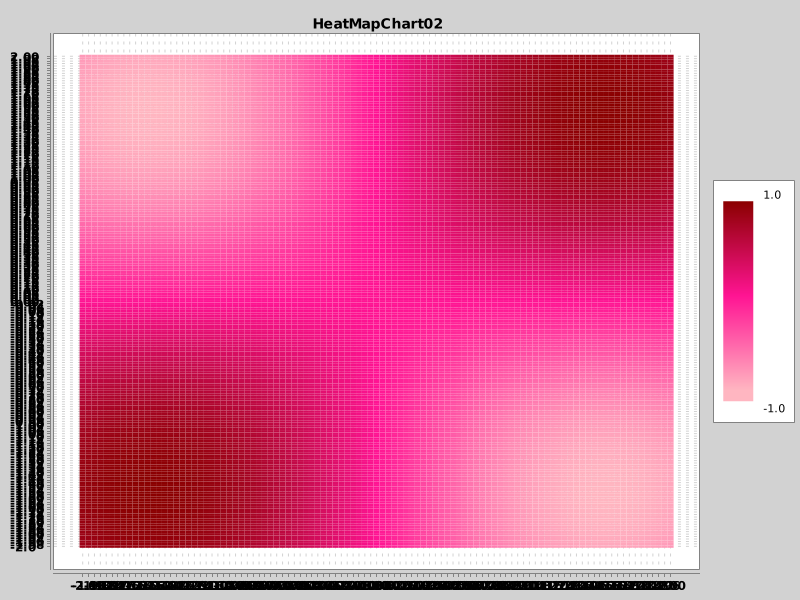
HeatMapChart02 - HeatMap Large
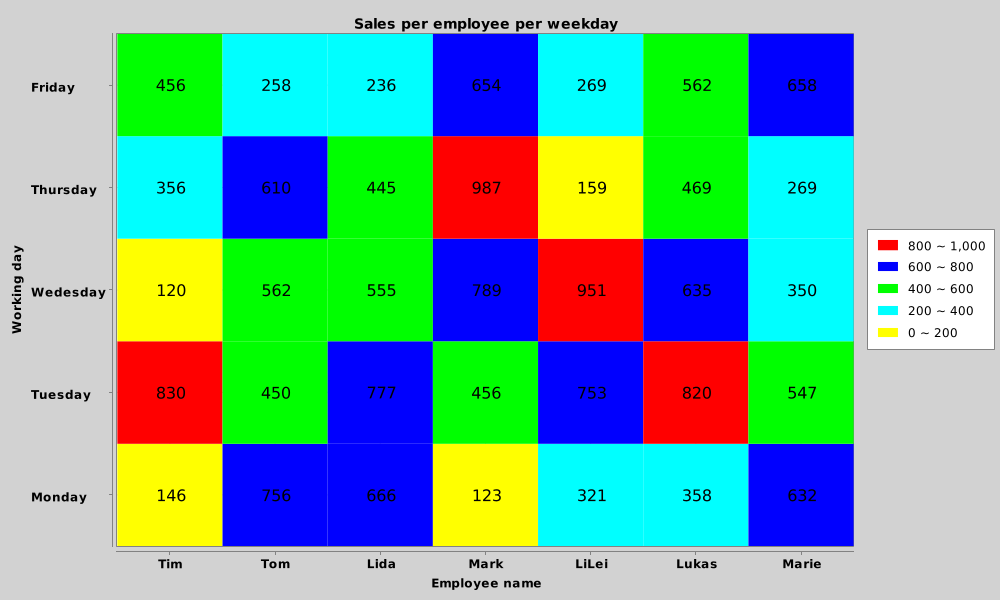
HeatMapChart03 - HeatMap Piecewise
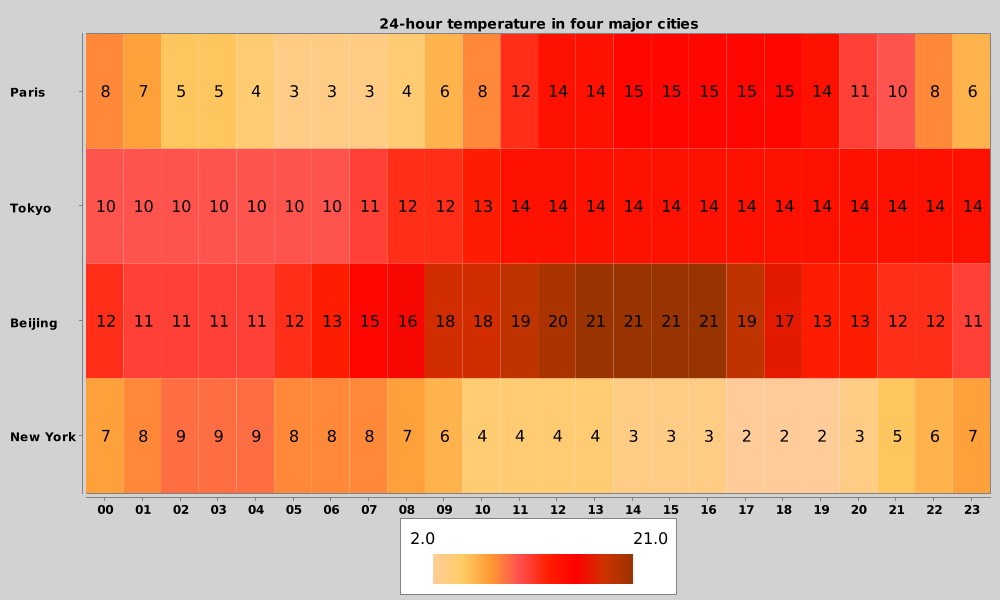
HeatMapChart04 - HeatMap X-Axis Data Date Type
HeatMapChart05 - HeatMap Piecewise (custom legend formatting)
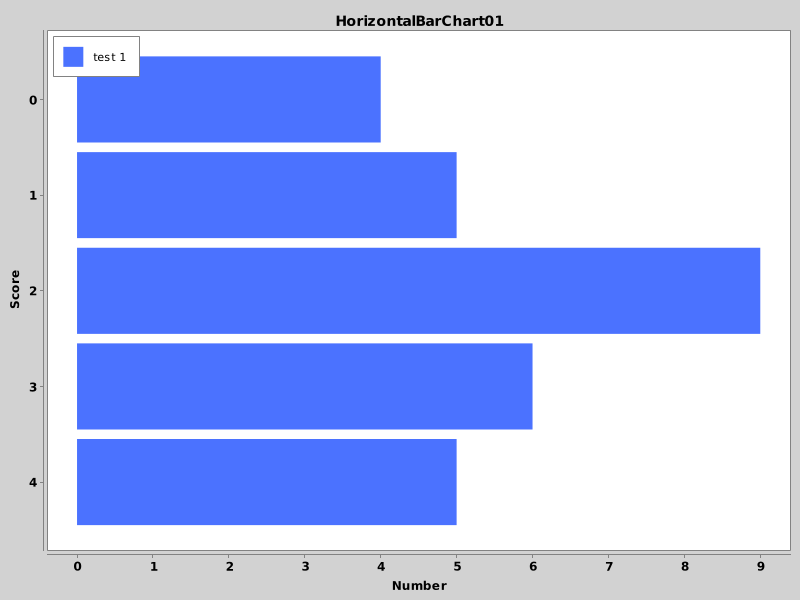
HorizontalBarChart01 - Basic Horizontal Bar Chart
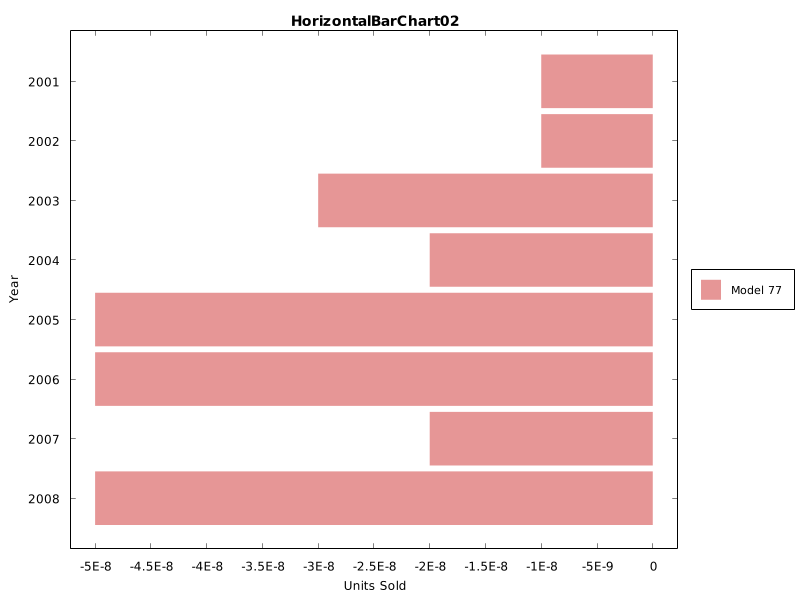
HorizontalBarChart02 - Date Categories
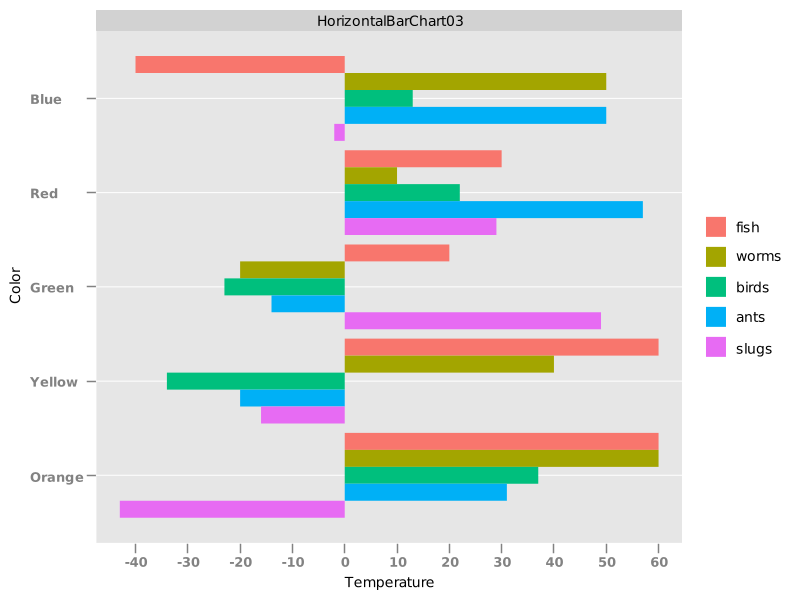
HorizontalBarChart03 - GGPlot2 Theme
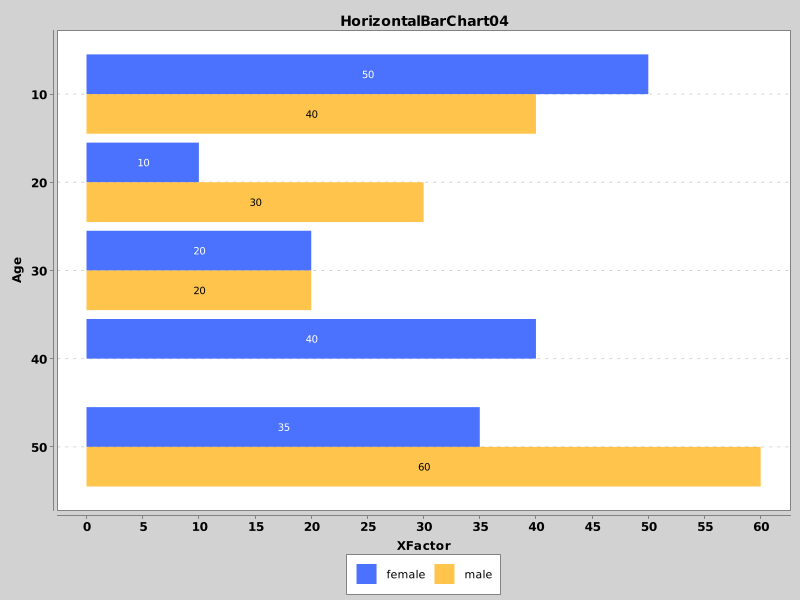
HorizontalBarChart04 - Multiple series, labels and tooltips
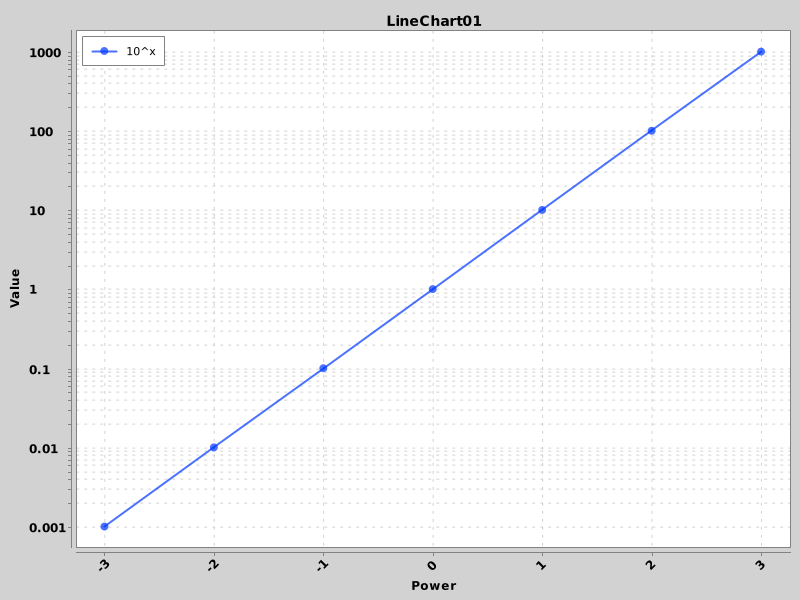
LineChart01 - Logarithmic Y-Axis
LineChart02 - Customized Series Style
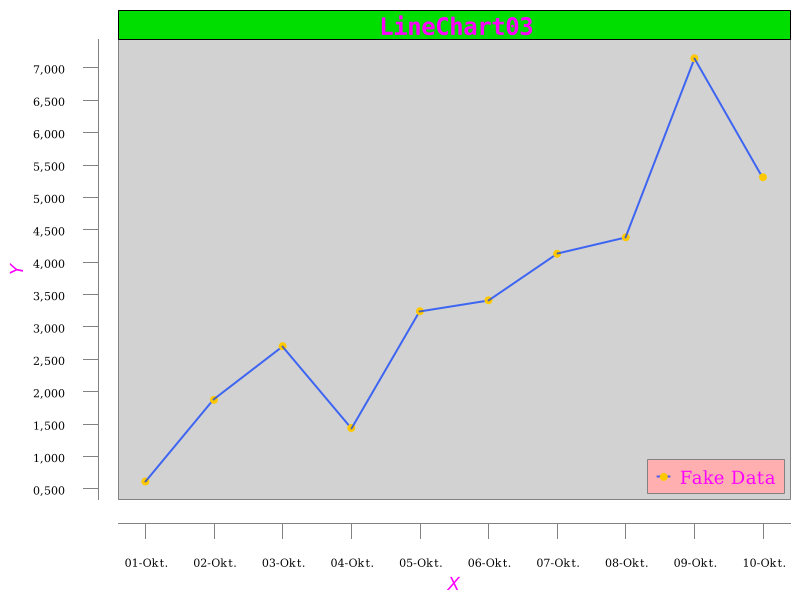
LineChart03 - Extensive Chart Customization
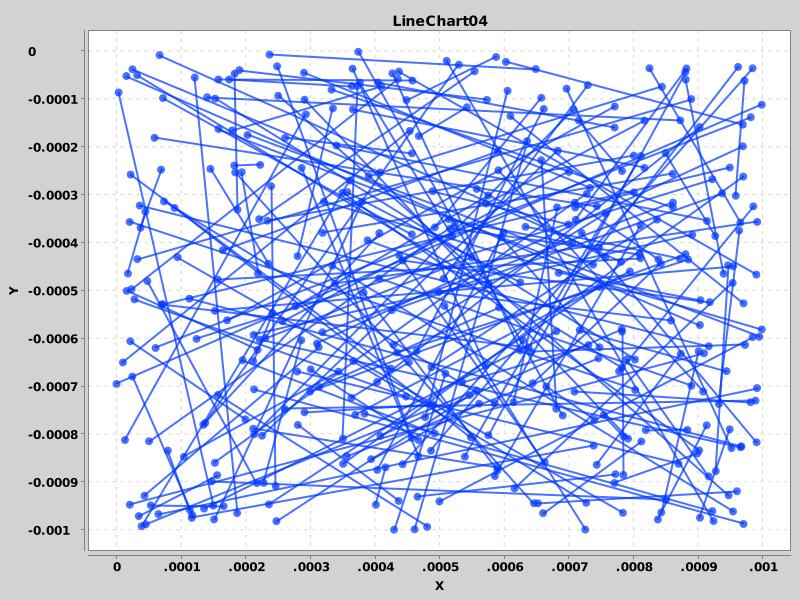
LineChart04 - Hundreds of Series on One Plot
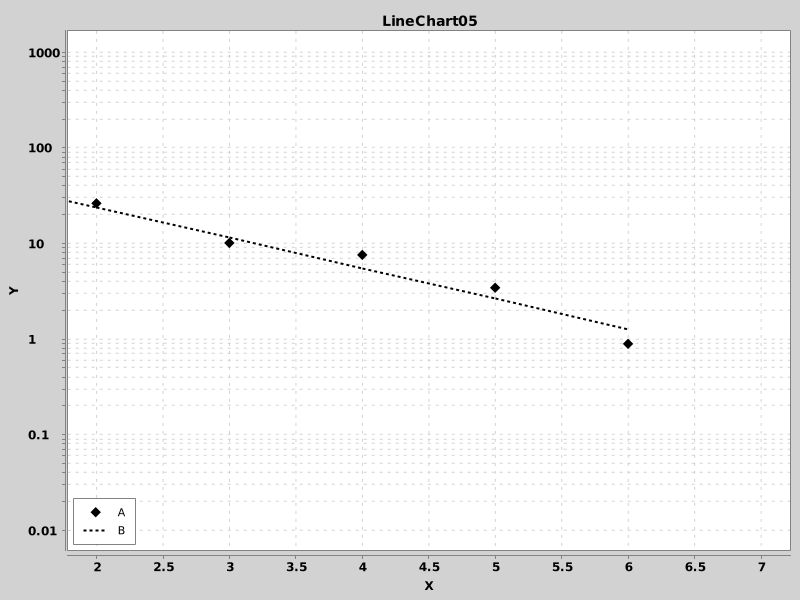
LineChart05 - Scatter and Line with Tool Tips
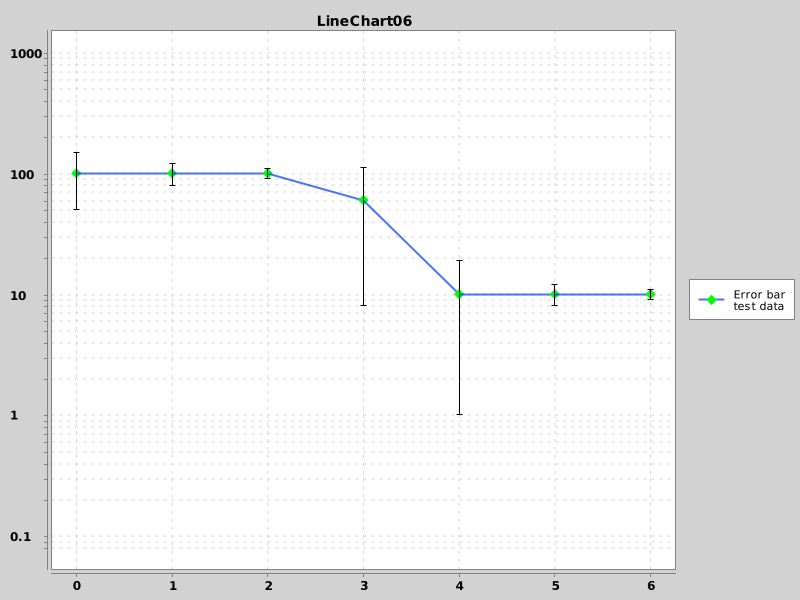
LineChart06 - Logarithmic Y-Axis with Error Bars
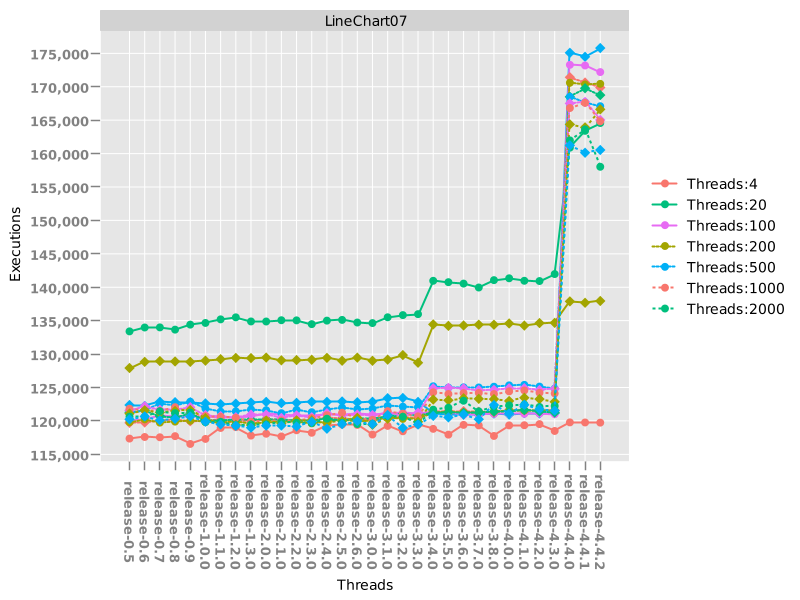
LineChart07 - Category Chart with Line Rendering
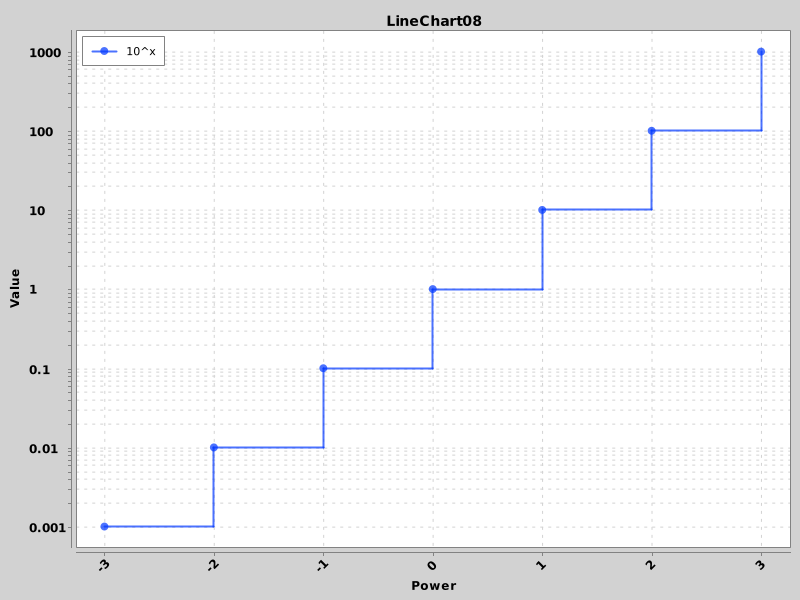
LineChart08 - Step Rendering
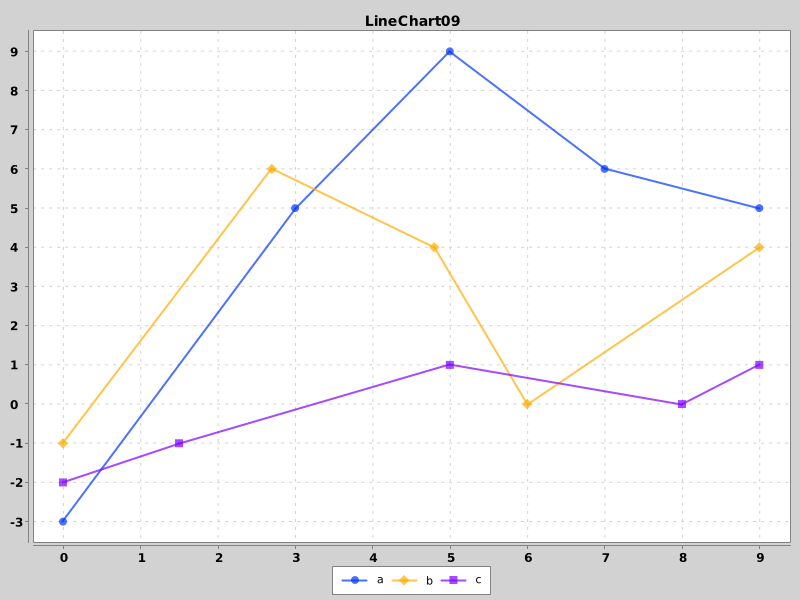
LineChart09 - Cursor
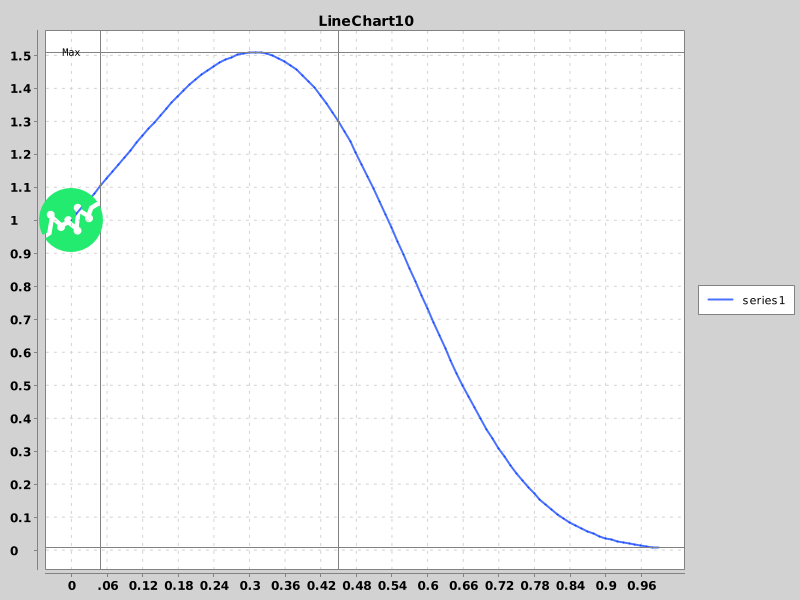
LineChart10 - Annotations
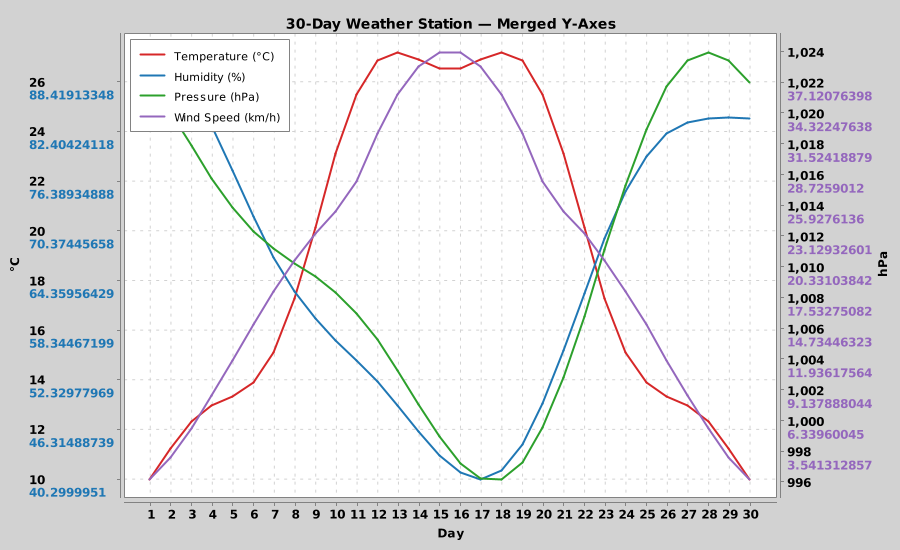
LineChart11 - Merged Y-Axes (Weather Station)
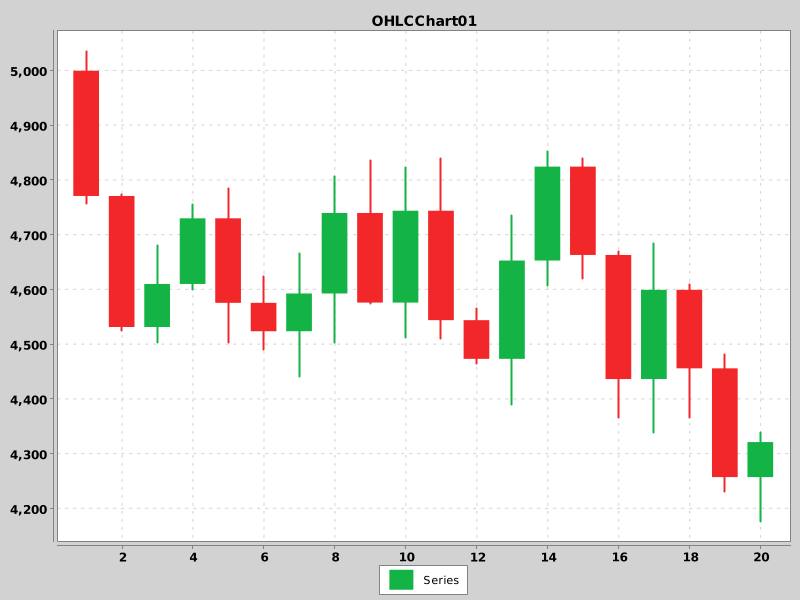
OHLCChart01 - HiLo rendering
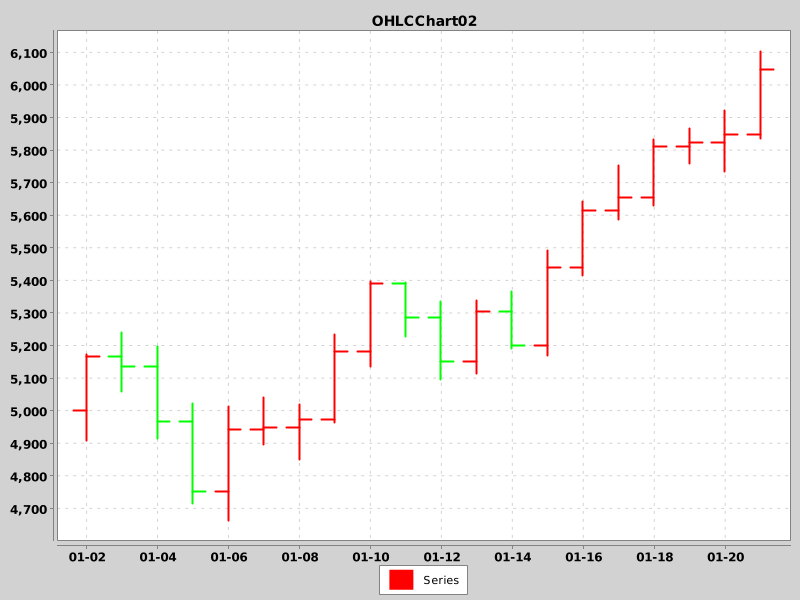
OHLCChart02 - Candle with custom colors
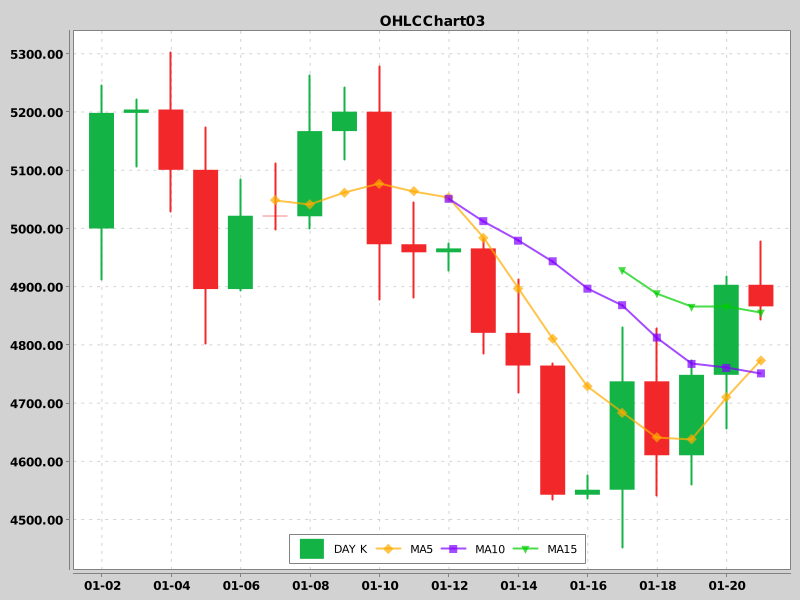
OHLCChart03 - Candle and lines
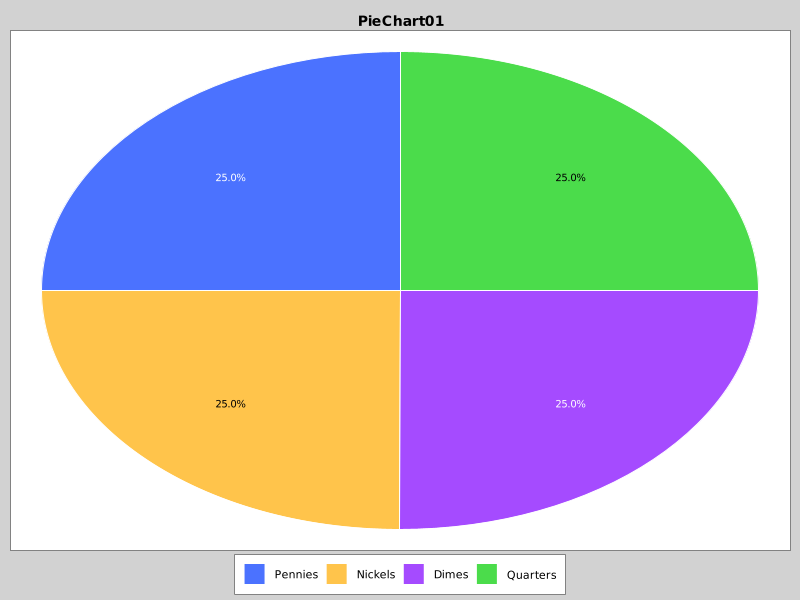
PieChart01 - Pie Chart with 4 Slices
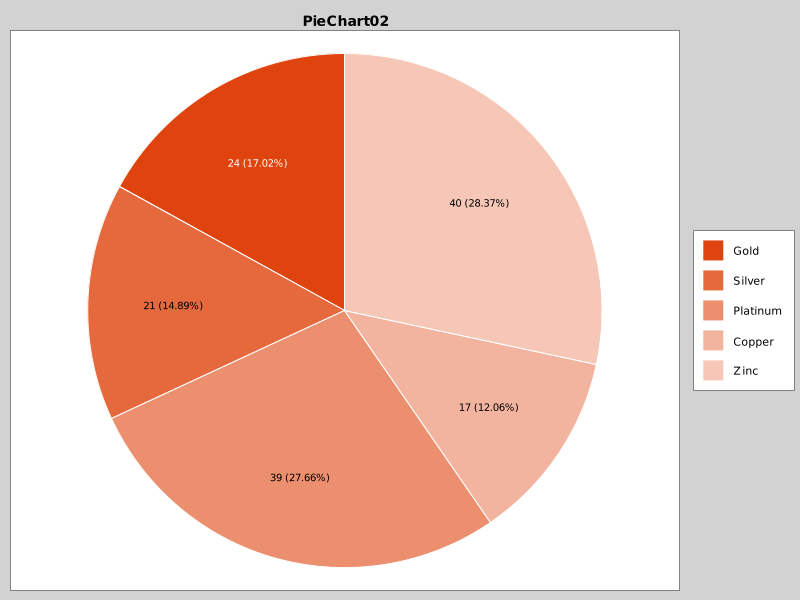
PieChart02 - Pie Chart Custom Color Palette
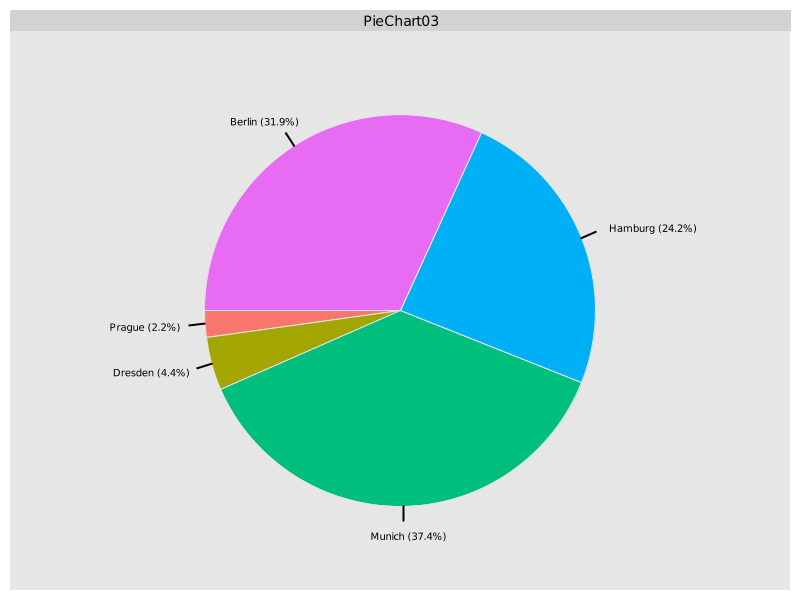
PieChart03 - Pie Chart GGPlot2 Theme
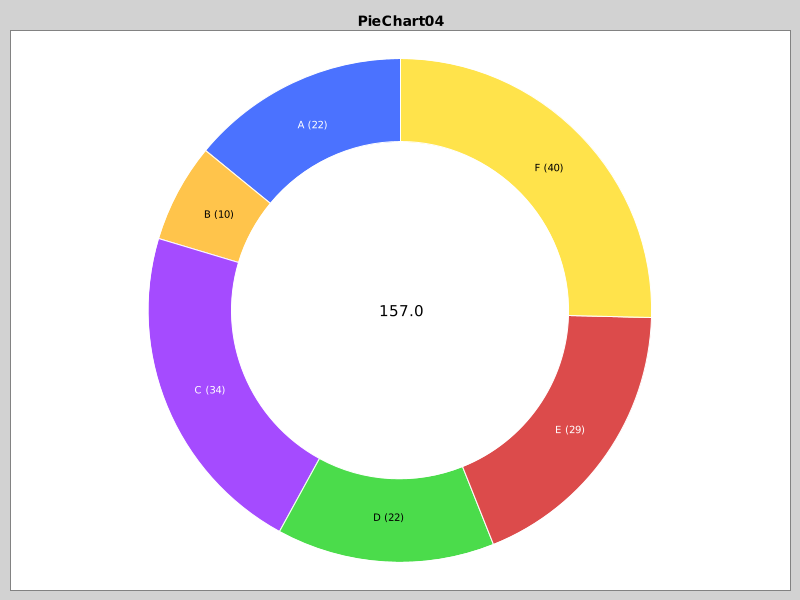
PieChart04 - Pie Chart with Donut Style
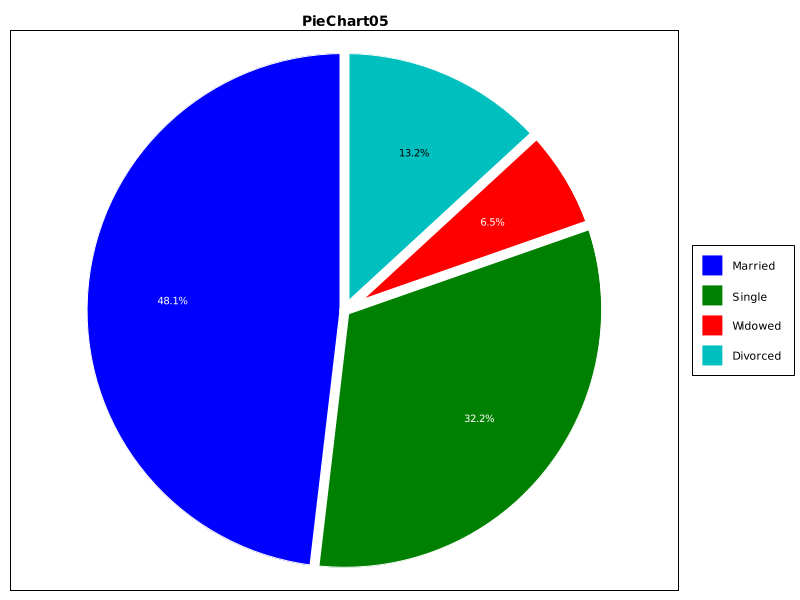
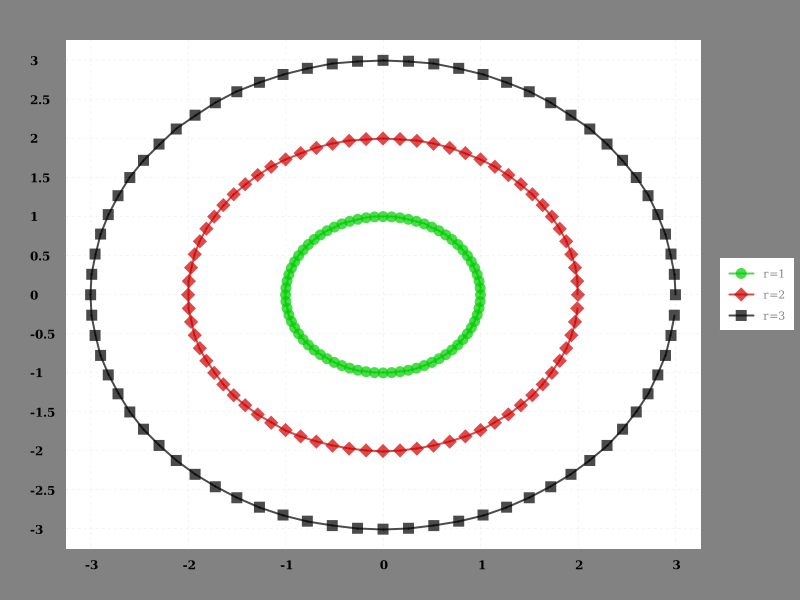
PieChart05 - Pie Chart with Matlab Theme
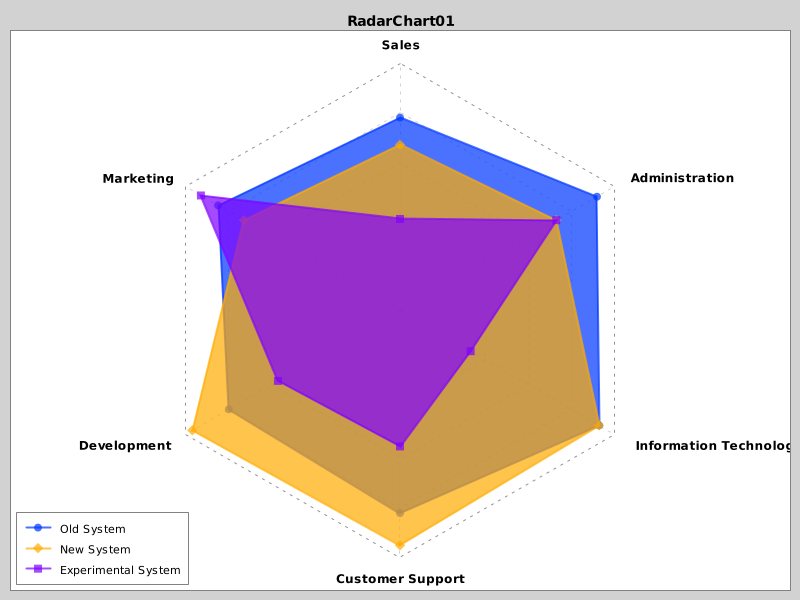
RadarChart01 - Basic Radar Chart
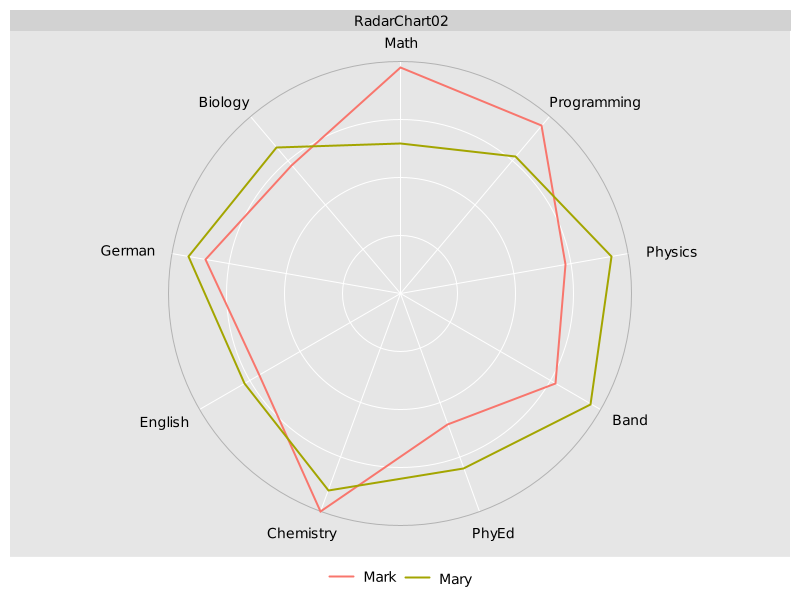
RadarChart02 - Circular Radar Chart with GGplot2 Theme
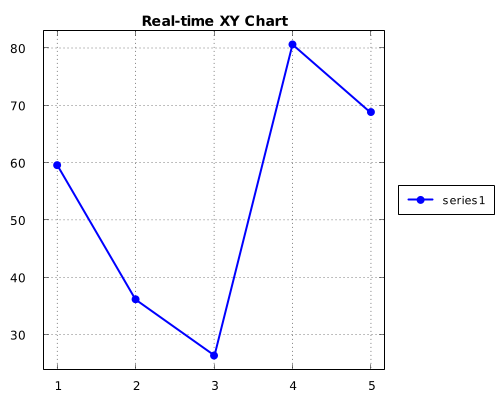
RealtimeChart01 - Real-time XY Chart
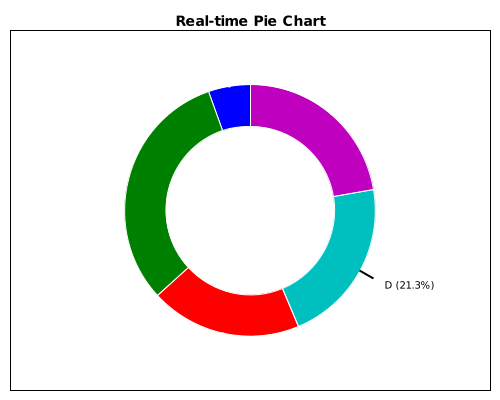
RealtimeChart02 - Real-time Pie Chart
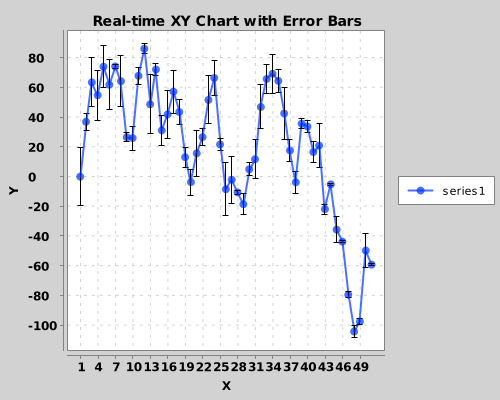
RealtimeChart03 - Real-time XY Chart with Error Bars
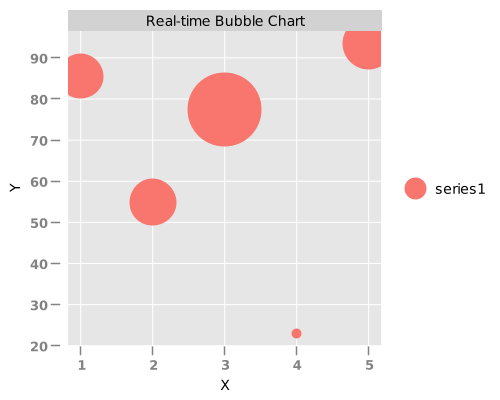
RealtimeChart04 - Real-time Bubble Chart
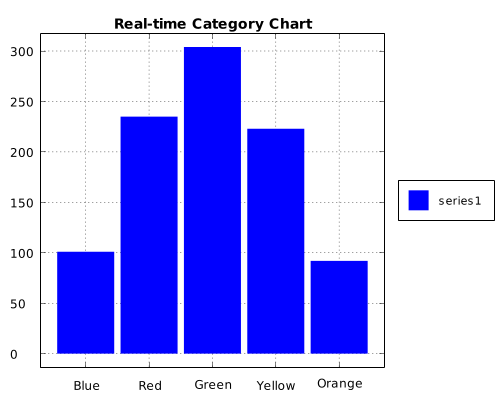
RealtimeChart05 - Real-time Category Chart
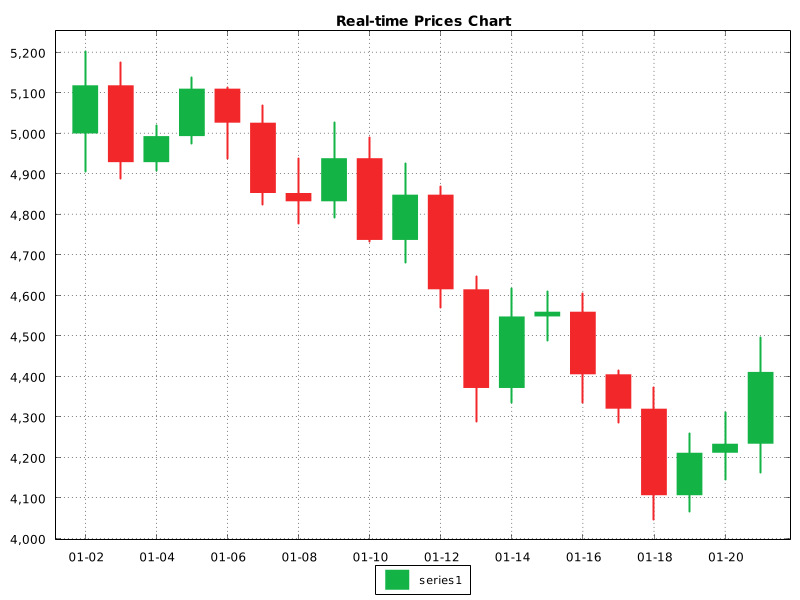
RealtimeChart06 - Real-time OHLC Chart
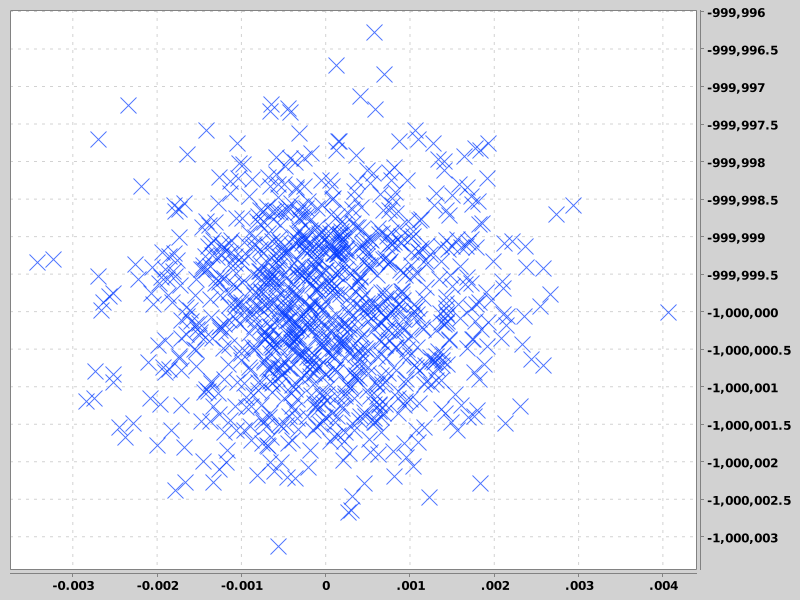
ScatterChart01 - Gaussian Blob with Y Axis on Right
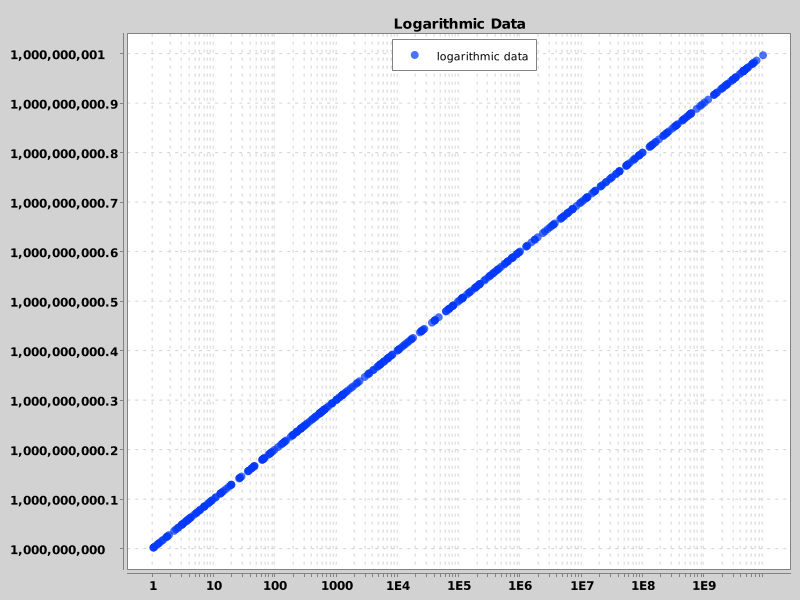
ScatterChart02 - Logarithmic Data
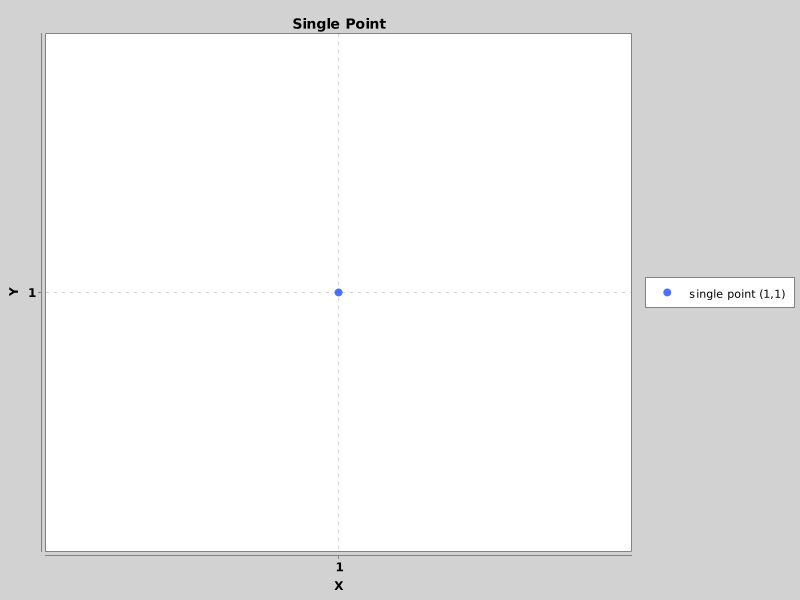
ScatterChart03 - Single Point
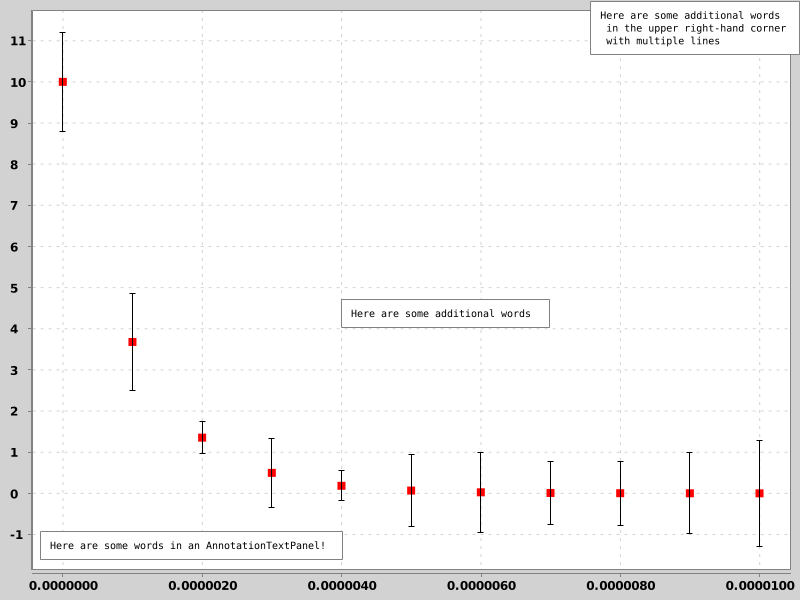
ScatterChart04 - Error Bars
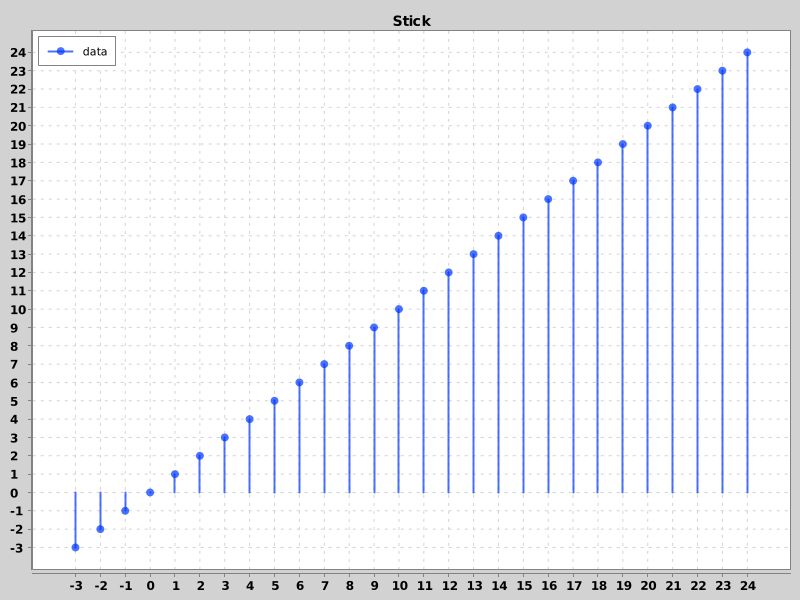
StickChart01 - Basic Stick Chart
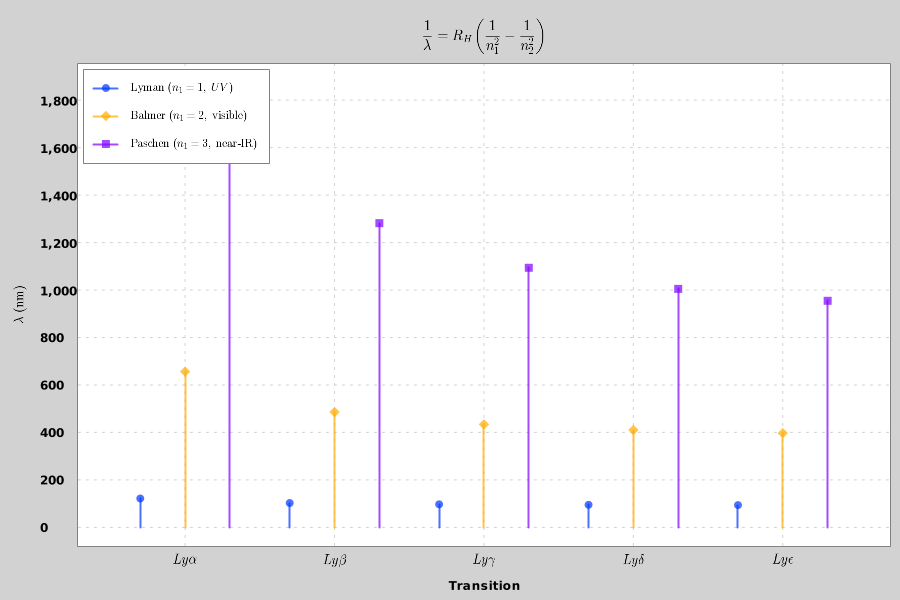
StickChart02 - Hydrogen Spectral Lines with TeX Labels
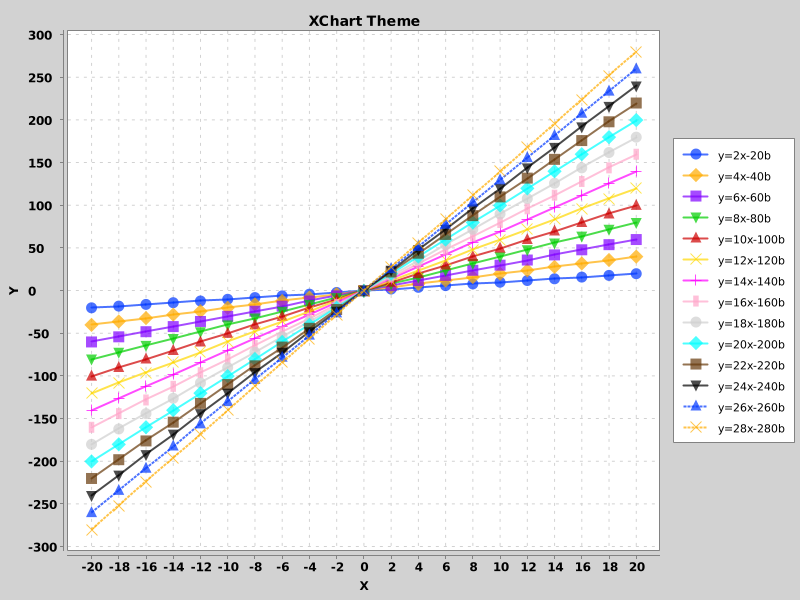
ThemeChart01 - Default XChart Theme
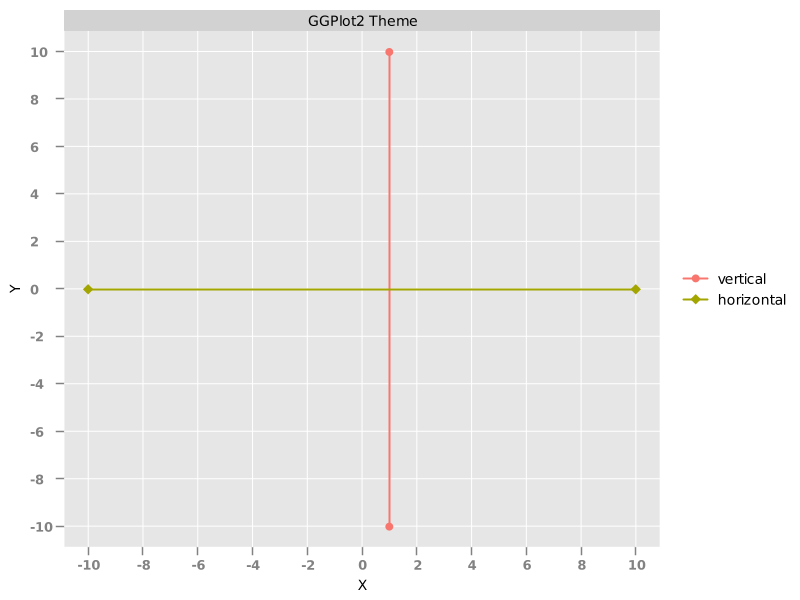
ThemeChart02 - GGPlot2 Theme
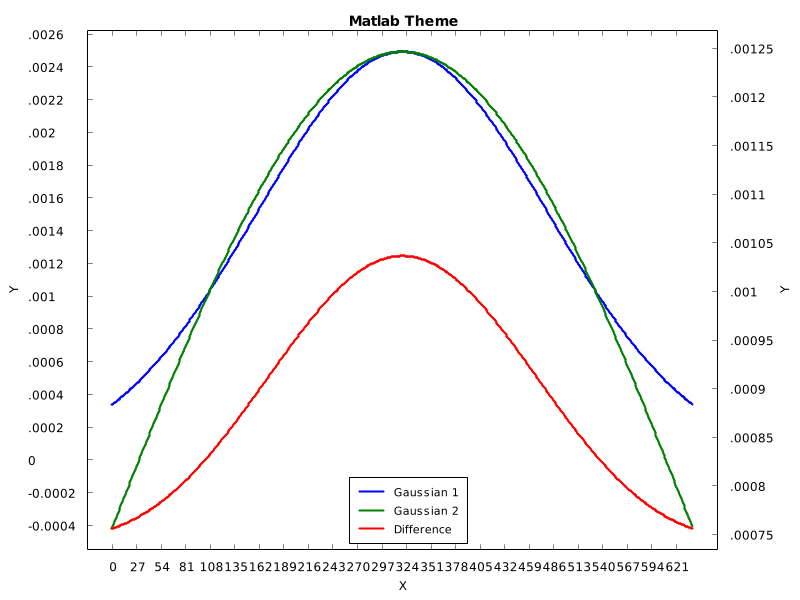
ThemeChart03 - Matlab Theme
ThemeChart04 - My Custom Theme